

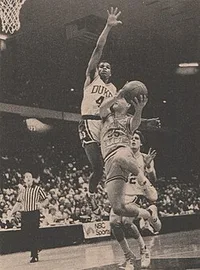
Mark Price
Career 722 G · 10,989 PTS · 15.2 PPG · 2.6 RPG · 6.7 APG
Seasons leading the NBA
3
11
Top-5 finishes
3
Title seasons
1
Categories led
1991
Best season
Spanning 1991–1996, peaking at 1 titles in 1991.
Clubs
50-40-90 Seasons
All-Time Standing
Against every player since 1951Among league leaders
- 94th League titles 3
- 159th Top-5 finishes 11
Each rank is against the players who have achieved that thing at least once.
Career leaderboards
- 3rd Free Throw Percentage 90.4%
- 35th Assists per Game 6.7
- 42nd Three-Point Percentage 40.2%
- 78th Total Assists 4,863
- 89th True Shooting Percentage 58.6%
- 143rd Effective FG Percentage 53.0%
- 180th Turnovers 1,790
- 195th Steals per Game 1.2
- 197th Three-Pointers Made 976
- 264th Total Steals 860
- 270th Points per Game 15.2
- 337th Total Points 10,989
- 342nd Field Goal Percentage 47.2%
- 345th Free Throws Made 2,135
- 372nd Field Goals Made 3,939
All-time career totals, top 500 per category.
Where He Led
| Category | Titles | Best | Streak | Seasons |
|---|---|---|---|---|
| Free Throw Percentage | 3 | 1st | 2 yrs (1991–1992) | 1991-1992 94.7% 1992-1993 94.8% 1996-1997 90.6% 1994-1995 #2 |
| Three-Pointers Made | — | #2 | — | 1989-1990 #2 |
| Effective FG Percentage | — | #3 | — | 1988-1989 #3 |
| Three-Point Percentage | — | #2 | — | 1988-1989 #2 1992-1993 #2 |
Title Seasons
3 seasons with at least one titleSeason Averages
led the league 12 seasons| Year | Team | GP | MPG | PTS | PPG | REB | RPG | AST | APG | STL | BLK | TOV | FG% | 3P% | FT% |
|---|---|---|---|---|---|---|---|---|---|---|---|---|---|---|---|
| 1986-1987 | CLE | 67 | 18.2 | 464 | 6.9 | 117 | 1.7 | 202 | 3.0 | 43 | 4 | 105 | 40.8% | 32.9% | 83.3% |
| 1987-1988 | CLE | 80 | 32.8 | 1,279 | 16.0 | 180 | 2.3 | 480 | 6.0 | 99 | 12 | 184 | 50.6% | 48.6% | 87.7% |
| 1988-1989 | CLE | 75 | 36.4 | 1,414 | 18.9 | 226 | 3.0 | 631 | 8.4 | 115 | 7 | 212 | 52.6% | 44.1% | 90.1% |
| 1989-1990 | CLE | 73 | 37.1 | 1,430 | 19.6 | 251 | 3.4 | 666 | 9.1 | 114 | 5 | 214 | 45.9% | 40.6% | 88.8% |
| 1990-1991 | CLE | 16 | 35.7 | 271 | 16.9 | 45 | 2.8 | 166 | 10.4 | 42 | 2 | 56 | 49.7% | 34.0% | 95.2% |
| 1991-1992 | CLE | 72 | 29.7 | 1,247 | 17.3 | 173 | 2.4 | 535 | 7.4 | 94 | 12 | 159 | 48.8% | 38.7% | 94.7% |
| 1992-1993 | CLE | 75 | 31.7 | 1,365 | 18.2 | 201 | 2.7 | 602 | 8.0 | 89 | 11 | 196 | 48.4% | 41.6% | 94.8% |
| 1993-1994 | CLE | 76 | 31.4 | 1,316 | 17.3 | 228 | 3.0 | 589 | 7.8 | 103 | 11 | 189 | 47.8% | 39.7% | 88.8% |
| 1994-1995 | CLE | 48 | 28.6 | 757 | 15.8 | 112 | 2.3 | 335 | 7.0 | 35 | 4 | 142 | 41.3% | 40.7% | 91.4% |
| 1995-1996 | WAS | 7 | 18.1 | 56 | 8.0 | 7 | 1.0 | 18 | 2.6 | 6 | 0 | 10 | 30.0% | 33.3% | 100.0% |
| 1996-1997 | GSW | 70 | 26.8 | 793 | 11.3 | 179 | 2.6 | 342 | 4.9 | 67 | 3 | 161 | 44.7% | 39.6% | 90.6% |
| 1997-1998 | ORL | 63 | 22.7 | 597 | 9.5 | 129 | 2.0 | 297 | 4.7 | 53 | 5 | 162 | 43.1% | 33.5% | 84.5% |
| Career | — | 722 | 29.9 | 10,989 | 15.2 | 1,848 | 2.6 | 4,863 | 6.7 | 860 | 76 | 1,790 | 47.2% | 40.2% | 90.4% |