

1992 NL Catcher Range Factor Leaders
Putouts plus assists per game at catcher
Joe Oliver led the NL in catcher range factor in 1992 with 7.01, 0.39 ahead of Mike Scioscia (6.62).
Showing players with at least 81 games at the position — the fielding-title rule of half of the team's games. Show all players
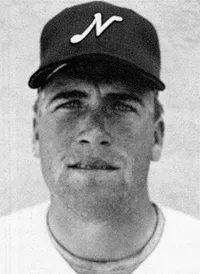 Led the NL in 1992
Joe Oliver
Cincinnati Reds
7.01
Catcher Range Factor
0.39 clear of Mike Scioscia
Showing Catcher Range Factor and the stats that give it context
Full stat line
| # | Player | Team | C RF | G | PO | A | E |
|---|---|---|---|---|---|---|---|
| 1 |
 Joe Oliver |
CIN | 7.01 | 141 | 925 | 64 | 8 |
| 2 |
 Mike Scioscia |
LAN | 6.62 | 108 | 641 | 74 | 9 |
| 3 |
 Gary Carter |
MON | 6.27 | 85 | 481 | 52 | 6 |
| 4 |
 Benito Santiago |
SDN | 6.18 | 103 | 584 | 53 | 12 |
| 5 |
 Todd Hundley |
NYN | 6.18 | 121 | 700 | 48 | 3 |
| 6 |
 Ed Taubensee |
HOU | 6.05 | 103 | 557 | 66 | 5 |
| 7 | Greg Olson | ATL | 6.01 | 94 | 522 | 43 | 1 |
| 8 |
 Darren Daulton |
PHI | 5.88 | 141 | 760 | 69 | 11 |
| 9 |
 Kirt Manwaring |
SFN | 5.85 | 108 | 564 | 68 | 4 |
| 10 |
 Damon Berryhill |
ATL | 5.44 | 84 | 426 | 31 | 1 |
| 11 |
 Tom Pagnozzi |
SLN | 5.37 | 138 | 688 | 53 | 1 |
| 12 |
 Mike LaValliere |
PIT | 5.25 | 92 | 421 | 62 | 3 |
| 13 |
 Joe Girardi |
CHN | 4.88 | 86 | 369 | 51 | 4 |