

1994 AL Pitcher Range Factor Leaders
Putouts plus assists per game at pitcher
Alex Fernandez led the AL in pitcher range factor in 1994 with 2.29, 0.21 ahead of Mike Moore (2.08).
Showing pitchers with at least 113.0 innings — the same bar the ERA title asks for. Show all players
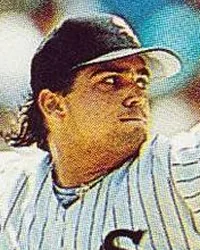 Led the AL in 1994
Alex Fernandez
Chicago White Sox
2.29
Pitcher Range Factor
0.21 clear of Mike Moore
Showing Pitcher Range Factor and the stats that give it context
Full stat line
| # | Player | Team | P RF | G | PO | A | E |
|---|---|---|---|---|---|---|---|
| 1 |
 Alex Fernandez |
CHA | 2.29 | 24 | 16 | 39 | 1 |
| 2 |
 Mike Moore |
DET | 2.08 | 25 | 22 | 30 | 0 |
| 3 |
 Kevin Brown |
TEX | 1.96 | 26 | 20 | 31 | 4 |
| 4 |
 Chris Bosio |
SEA | 1.84 | 19 | 11 | 24 | 0 |
| 5 |
 Jimmy Key |
NYA | 1.84 | 25 | 6 | 40 | 2 |
| 6 |
 Dennis Martinez |
CLE | 1.83 | 24 | 11 | 33 | 0 |
| 7 |
 Mike Mussina |
BAL | 1.75 | 24 | 14 | 28 | 1 |
| 8 |
 Kenny Rogers |
TEX | 1.75 | 24 | 9 | 33 | 4 |
| 9 |
 Bill Wegman |
ML4 | 1.74 | 19 | 12 | 21 | 1 |
| 10 |
 Tim Belcher |
DET | 1.72 | 25 | 18 | 25 | 4 |
| 11 |
 Cal Eldred |
ML4 | 1.72 | 25 | 20 | 23 | 0 |
| 12 |
 Randy Johnson |
SEA | 1.70 | 23 | 12 | 27 | 0 |
| 13 |
 Mark Gubicza |
KCA | 1.68 | 22 | 17 | 20 | 3 |
| 14 |
 Mark Langston |
CAL | 1.67 | 18 | 3 | 27 | 2 |
| 15 |
 David Cone |
KCA | 1.65 | 23 | 20 | 18 | 3 |
| 16 |
 Kevin Tapani |
MIN | 1.58 | 24 | 11 | 27 | 1 |
| 17 |
 Tom Gordon |
KCA | 1.54 | 24 | 12 | 25 | 2 |
| 18 |
 Charles Nagy |
CLE | 1.52 | 23 | 9 | 26 | 2 |
| 19 |
 Scott Erickson |
MIN | 1.43 | 23 | 11 | 22 | 4 |
| 20 |
 Bill Gullickson |
DET | 1.43 | 21 | 15 | 15 | 1 |
| 21 | Mark Clark | CLE | 1.40 | 20 | 5 | 23 | 0 |
| 22 | Steve Ontiveros | OAK | 1.37 | 27 | 15 | 22 | 0 |
| 23 |
 Melido Perez |
NYA | 1.36 | 22 | 15 | 15 | 1 |
| 24 |
 Jack Morris |
CLE | 1.35 | 23 | 12 | 19 | 4 |
| 25 |
 Pat Hentgen |
TOR | 1.33 | 24 | 12 | 20 | 0 |
| 26 |
 Ben McDonald |
BAL | 1.33 | 24 | 7 | 25 | 0 |
| 27 |
 Jim Abbott |
NYA | 1.29 | 24 | 8 | 23 | 1 |
| 28 |
 Jamie Moyer |
BAL | 1.26 | 23 | 12 | 17 | 0 |
| 29 |
 Jack McDowell |
CHA | 1.24 | 25 | 8 | 23 | 0 |
| 30 |
 Ron Darling |
OAK | 1.16 | 25 | 3 | 26 | 2 |
| 31 | Scott Kamieniecki | NYA | 1.14 | 22 | 8 | 17 | 1 |
| 32 |
 Roger Clemens |
BOS | 1.13 | 24 | 8 | 19 | 2 |
| 33 | Pat Mahomes | MIN | 1.10 | 21 | 11 | 12 | 1 |
| 34 |
 Chuck Finley |
CAL | 1.04 | 25 | 9 | 17 | 4 |
| 35 | Dave Fleming | SEA | 1.00 | 23 | 8 | 15 | 1 |
| 36 |
 Ricky Bones |
ML4 | 0.92 | 24 | 8 | 14 | 1 |
| 37 |
 Aaron Sele |
BOS | 0.91 | 22 | 6 | 14 | 0 |
| 38 | Jason Bere | CHA | 0.88 | 24 | 9 | 12 | 2 |
| 39 |
 Kevin Appier |
KCA | 0.87 | 23 | 7 | 13 | 0 |
| 40 |
 Todd Stottlemyre |
TOR | 0.85 | 26 | 10 | 12 | 0 |
| 41 |
 Bobby Witt |
OAK | 0.83 | 24 | 7 | 13 | 4 |
| 42 | Wilson Alvarez | CHA | 0.79 | 24 | 6 | 13 | 0 |
| 43 | Terry Mulholland | NYA | 0.79 | 24 | 4 | 15 | 1 |
| 44 |
 Dave Stewart |
TOR | 0.77 | 22 | 11 | 6 | 0 |
| 45 |
 Jim Deshaies |
MIN | 0.76 | 25 | 3 | 16 | 1 |
| 46 |
 Juan Guzman |
TOR | 0.68 | 25 | 5 | 12 | 2 |
| 47 |
 Sid Fernandez |
BAL | 0.53 | 19 | 1 | 9 | 0 |
| 48 | Todd Van Poppel | OAK | 0.52 | 23 | 1 | 11 | 0 |