

2006 NFC Touchdown Percentage Leaders
Touchdowns per pass attempt
Tony Romo led the NFC in touchdown percentage in 2006 with 5.6%, 0.2 percentage points ahead of Donovan McNabb (5.4%).
Showing players who met 14 pass attempts per team game. Show all players
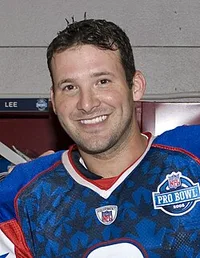 Led the NFC in 2006
Tony Romo
Dallas Cowboys
5.6%
Touchdown Percentage
0.2% clear of Donovan McNabb
Showing Touchdown Percentage and the stats that give it context
Full stat line
| # | Player | Team | TD% | G | ATT | YDS | TD |
|---|---|---|---|---|---|---|---|
| 1 |
 Tony Romo |
DAL | 5.6% | 13 | 337 | 2,903 | 19 |
| 2 |
 Donovan McNabb |
PHI | 5.4% | 10 | 316 | 2,612 | 17 |
| 3 |
 Mike Vick |
ATL | 5.1% | 16 | 389 | 2,474 | 20 |
| 4 |
 Matt Hasselbeck |
SEA | 4.9% | 12 | 371 | 2,442 | 18 |
| 5 |
 Rex Grossman |
CHI | 4.8% | 16 | 480 | 3,197 | 23 |
| 6 |
 Drew Brees |
NO | 4.7% | 16 | 555 | 4,424 | 26 |
| 7 |
 Eli Manning |
NYG | 4.6% | 16 | 522 | 3,244 | 24 |
| 8 |
 Marc Bulger |
LA | 4.1% | 16 | 588 | 4,301 | 24 |
| 9 |
 Jake Delhomme |
CAR | 3.9% | 13 | 431 | 2,805 | 17 |
| 10 |
 Alex Smith |
SF | 3.6% | 16 | 443 | 2,901 | 16 |
| 11 |
 Jon Kitna |
DET | 3.5% | 16 | 596 | 4,208 | 21 |
| 12 |
 Mark Brunell |
WAS | 3.1% | 10 | 261 | 1,789 | 8 |
| 13 |
 Brett Favre |
GB | 2.9% | 16 | 613 | 3,885 | 18 |
| 14 |
 Matt Leinart |
ARI | 2.9% | 12 | 376 | 2,542 | 11 |
| 15 |
 Bruce Gradkowski |
TB | 2.7% | 13 | 328 | 1,661 | 9 |
| 16 |
 Brad Johnson |
MIN | 2.1% | 15 | 439 | 2,750 | 9 |