

2018 AFC Yards per Carry Leaders
Rushing yards per attempt
Phillip Lindsay led the AFC in yards per carry in 2018 with 5.40, 0.16 ahead of Gus Edwards (5.24).
Showing players who met 6.25 carries per team game. Show all players
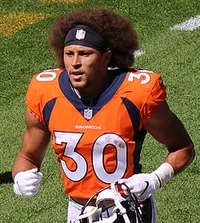 Led the AFC in 2018
Phillip Lindsay
Denver Broncos
5.40
Yards per Carry
0.16 clear of Gus Edwards
Showing Yards per Carry and the stats that give it context
Full stat line
| # | Player | Team | Y/A | G | ATT | YDS | TD |
|---|---|---|---|---|---|---|---|
| 1 |
 Phillip Lindsay |
DEN | 5.40 | 15 | 192 | 1,037 | 9 |
| 2 |
 Gus Edwards |
BAL | 5.24 | 11 | 137 | 718 | 2 |
| 3 |
 Austin Ekeler |
LAC | 5.23 | 14 | 106 | 554 | 3 |
| 4 |
 Nick Chubb |
CLE | 5.19 | 16 | 192 | 996 | 8 |
| 5 |
 Melvin Gordon |
LAC | 5.06 | 12 | 175 | 885 | 10 |
| 6 |
 Joe Mixon |
CIN | 4.93 | 14 | 237 | 1,168 | 8 |
| 7 |
 Derrick Henry |
TEN | 4.93 | 16 | 215 | 1,059 | 12 |
| 8 |
 Isaiah Crowell |
NYJ | 4.79 | 13 | 143 | 685 | 6 |
| 9 |
 Lamar Jackson |
BAL | 4.73 | 16 | 147 | 695 | 5 |
| 10 |
 Marlon Mack |
IND | 4.66 | 12 | 195 | 908 | 9 |
| 11 |
 Lamar Miller |
HOU | 4.63 | 14 | 210 | 973 | 5 |
| 12 |
 Frank Gore |
MIA | 4.63 | 14 | 156 | 722 | 0 |
| 13 |
 Kareem Hunt |
KC | 4.55 | 11 | 181 | 824 | 7 |
| 14 |
 James Conner |
PIT | 4.53 | 13 | 215 | 973 | 12 |
| 15 |
 Kenyan Drake |
MIA | 4.46 | 16 | 120 | 535 | 4 |
| 16 |
 Sony Michel |
NE | 4.45 | 13 | 209 | 931 | 6 |
| 17 |
 Doug Martin |
LV | 4.20 | 16 | 172 | 723 | 4 |
| 18 |
 Royce Freeman |
DEN | 4.01 | 14 | 130 | 521 | 5 |
| 19 |
 T.J. Yeldon |
JAX | 3.98 | 14 | 104 | 414 | 1 |
| 20 |
 Alex Collins |
BAL | 3.61 | 10 | 114 | 411 | 7 |
| 21 |
 Chris Ivory |
BUF | 3.35 | 13 | 115 | 385 | 1 |
| 22 |
 Dion Lewis |
TEN | 3.34 | 16 | 155 | 517 | 1 |
| 23 |
 Alfred Blue |
HOU | 3.33 | 16 | 150 | 499 | 2 |
| 24 |
 Carlos Hyde |
JAX | 3.32 | 14 | 172 | 571 | 5 |
| 25 |
 Leonard Fournette |
JAX | 3.30 | 8 | 133 | 439 | 5 |
| 26 |
 LeSean McCoy |
BUF | 3.19 | 14 | 161 | 514 | 3 |