

2025 NFC Touchdown Percentage Leaders
Touchdowns per pass attempt
Matthew Stafford led the NFC in touchdown percentage in 2025 with 7.7%, 0.7 percentage points ahead of Brock Purdy (7.0%).
Showing players who met 14 pass attempts per team game. Show all players
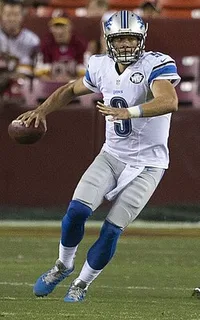 Led the NFC in 2025
Matthew Stafford
Los Angeles Rams
7.7%
Touchdown Percentage
0.7% clear of Brock Purdy
Showing Touchdown Percentage and the stats that give it context
Full stat line
| # | Player | Team | TD% | G | ATT | YDS | TD |
|---|---|---|---|---|---|---|---|
| 1 |
 Matthew Stafford |
LA | 7.7% | 17 | 597 | 4,707 | 46 |
| 2 |
 Brock Purdy |
SF | 7.0% | 9 | 284 | 2,167 | 20 |
| 3 |
 Jared Goff |
DET | 5.9% | 17 | 578 | 4,564 | 34 |
| 4 |
 Jalen Hurts |
PHI | 5.5% | 16 | 454 | 3,224 | 25 |
| 5 |
 Sam Darnold |
SEA | 5.2% | 17 | 477 | 4,048 | 25 |
| 6 |
 Jordan Love |
GB | 5.2% | 15 | 439 | 3,381 | 23 |
| 7 |
 Dak Prescott |
DAL | 5.0% | 17 | 600 | 4,552 | 30 |
| 8 |
 Bryce Young |
CAR | 4.8% | 16 | 478 | 3,011 | 23 |
| 9 |
 Baker Mayfield |
TB | 4.8% | 17 | 543 | 3,693 | 26 |
| 10 |
 Caleb Williams |
CHI | 4.8% | 17 | 568 | 3,942 | 27 |
| 11 |
 Jacoby Brissett |
ARI | 4.7% | 14 | 485 | 3,366 | 23 |
| 12 |
 J.J. McCarthy |
MIN | 4.5% | 10 | 243 | 1,632 | 11 |
| 13 |
 Mac Jones |
SF | 4.5% | 11 | 289 | 2,151 | 13 |
| 14 |
 Jaxson Dart |
NYG | 4.4% | 14 | 339 | 2,272 | 15 |
| 15 |
 Kirk Cousins |
ATL | 3.7% | 10 | 269 | 1,721 | 10 |
| 16 |
 Michael Penix Jr. |
ATL | 3.3% | 9 | 276 | 1,982 | 9 |
| 17 |
 Spencer Rattler |
NO | 3.1% | 9 | 257 | 1,586 | 8 |
| 18 |
 Tyler Shough |
NO | 3.1% | 11 | 327 | 2,384 | 10 |