

1974-1975 NBA Field Goals Attempted Leaders
Field goals attempted
Rick Barry led the NBA in field goals attempted in 1974-1975 with 2,217, 79 ahead of Bob McAdoo (2,138). It stands 9th among all single seasons in NBA history.
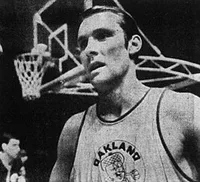 Led the NBA in 1974-1975
Rick Barry
GOS
2,217
Field Goals Attempted
79 clear of Bob McAdoo
Showing Field Goals Attempted and the stats that give it context
Full stat line
| # | Player | Team | FGA | GP | FGM | FG% |
|---|---|---|---|---|---|---|
| 1 |
 Rick Barry |
GOS | 2,217 | 80 | 1,028 | 46.4% |
| 2 |
 Bob McAdoo |
BUF | 2,138 | 82 | 1,095 | 51.2% |
| 3 |
 Elvin Hayes |
WAS | 1,668 | 82 | 739 | 44.3% |
| 4 |
 Nate Archibald |
KCK | 1,664 | 82 | 759 | 45.6% |
| 5 | Fred Carter | PHL | 1,598 | 77 | 715 | 44.7% |
| 6 |
 Charlie Scott |
PHX | 1,594 | 69 | 703 | 44.1% |
| 7 |
 Kareem Abdul-Jabbar |
MIL | 1,584 | 65 | 812 | 51.3% |
| 8 |
 Pete Maravich |
NOJ | 1,562 | 79 | 655 | 41.9% |
| 9 |
 Fred Brown |
SEA | 1,537 | 81 | 737 | 48.0% |
| 10 |
 Phil Chenier |
WAS | 1,533 | 77 | 690 | 45.0% |
| 11 |
 Earl Monroe |
NYK | 1,462 | 78 | 668 | 45.7% |
| 12 | Bob Dandridge | MIL | 1,460 | 80 | 691 | 47.3% |
| 13 |
 Jojo White |
BOS | 1,440 | 82 | 658 | 45.7% |
| 14 |
 Bob Lanier |
DET | 1,433 | 76 | 731 | 51.0% |
| 15 |
 Gail Goodrich |
LAL | 1,429 | 72 | 656 | 45.9% |
| 16 |
 Billy Cunningham |
PHL | 1,423 | 80 | 609 | 42.8% |
| 17 |
 John Havlicek |
BOS | 1,411 | 82 | 642 | 45.5% |
| 18 |
 Sidney Wicks |
POR | 1,391 | 82 | 692 | 49.7% |
| 19 |
 Walt Frazier |
NYK | 1,391 | 78 | 672 | 48.3% |
| 20 |
 Dave Bing |
DET | 1,333 | 79 | 578 | 43.4% |
| 21 | Spencer Haywood | SEA | 1,325 | 68 | 608 | 45.9% |
| 22 |
 Rudy Tomjanovich |
HOU | 1,323 | 81 | 694 | 52.5% |
| 23 |
 Geoff Petrie |
POR | 1,319 | 80 | 602 | 45.6% |
| 24 |
 Randy Smith |
BUF | 1,261 | 82 | 610 | 48.4% |
| 25 |
 Bob Love |
CHI | 1,256 | 61 | 539 | 42.9% |
| 26 |
 John Drew |
ATL | 1,230 | 78 | 527 | 42.8% |
| 27 |
 Bingo Smith |
CLE | 1,212 | 82 | 585 | 48.3% |
| 28 |
 Dave Cowens |
BOS | 1,199 | 65 | 569 | 47.5% |
| 29 |
 Jimmy Walker |
KCK | 1,164 | 81 | 553 | 47.5% |
| 30 |
 Calvin Murphy |
HOU | 1,152 | 78 | 557 | 48.4% |
| 31 |
 Doug Collins |
PHL | 1,150 | 81 | 561 | 48.8% |
| 32 |
 Jamaal Wilkes |
GOS | 1,135 | 82 | 502 | 44.2% |
| 33 |
 John Johnson |
POR | 1,082 | 80 | 527 | 48.7% |
| 34 |
 Chet Walker |
CHI | 1,076 | 76 | 524 | 48.7% |
| 35 | Mike Riordan | WAS | 1,057 | 74 | 520 | 49.2% |
| 36 |
 Bill Bradley |
NYK | 1,036 | 79 | 452 | 43.6% |
| 37 |
 Dick Snyder |
CLE | 988 | 82 | 498 | 50.4% |
| 38 |
 Norm Van Lier |
CHI | 970 | 70 | 407 | 42.0% |
| 39 | Charlie Johnson | GOS | 957 | 79 | 394 | 41.2% |
| 40 | Archie Clark | SEA | 919 | 77 | 455 | 49.5% |
| 41 |
 Sam Lacey |
KCK | 917 | 81 | 392 | 42.7% |
| 42 | Curtis Perry | PHX | 917 | 79 | 437 | 47.7% |
| 43 |
 Jim Chones |
CLE | 916 | 72 | 446 | 48.7% |
| 44 | Mike Bantom | PHX | 907 | 82 | 418 | 46.1% |
| 45 |
 Mike Newlin |
HOU | 905 | 79 | 436 | 48.2% |
| 46 |
 Dick Van Arsdale |
PHX | 895 | 70 | 421 | 47.0% |
| 47 | Tom Henderson | ATL | 893 | 79 | 367 | 41.1% |
| 48 |
 Curtis Rowe |
DET | 874 | 82 | 422 | 48.3% |
| 49 |
 Lloyd Neal |
POR | 869 | 82 | 409 | 47.1% |
| 50 |
 Jerry Sloan |
CHI | 865 | 78 | 380 | 43.9% |
1–50 of 215Next →