

1991-1992 NBA Blocks per Game Leaders
Blocked shots per game
David Robinson led the NBA in blocks per game in 1991-1992 with 4.5, 0.2 ahead of Hakeem Olajuwon (4.3). It stands 7th among all single seasons in NBA history. It was one of 2 times David Robinson led in blocks per game.
Showing players who met the games-played minimum for the season. Show all players
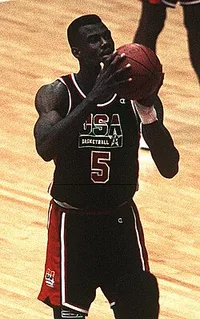 Led the NBA in 1991-1992
David Robinson
SAN
4.5
Blocks per Game
0.2 clear of Hakeem Olajuwon
Showing Blocks per Game and the stats that give it context
Full stat line
| # | Player | Team | BPG | GP | MPG | STL | BLK |
|---|---|---|---|---|---|---|---|
| 1 |
 David Robinson |
SAN | 4.5 | 68 | 37.7 | 158 | 305 |
| 2 |
 Hakeem Olajuwon |
HOU | 4.3 | 70 | 37.7 | 127 | 304 |
| 3 |
 Larry Nance |
CLE | 3.0 | 81 | 35.6 | 80 | 243 |
| 4 |
 Patrick Ewing |
NYK | 3.0 | 82 | 38.4 | 88 | 245 |
| 5 |
 Dikembe Mutombo |
DEN | 3.0 | 71 | 38.3 | 43 | 210 |
| 6 |
 Manute Bol |
PHL | 2.9 | 71 | 17.8 | 11 | 205 |
| 7 | Duane Causwell | SAC | 2.7 | 80 | 28.6 | 47 | 215 |
| 8 |
 Pervis Ellison |
WAS | 2.7 | 66 | 38.0 | 62 | 177 |
| 9 |
 Mark Eaton |
UTH | 2.5 | 81 | 25.0 | 36 | 205 |
| 10 | Andrew Lang | PHX | 2.5 | 81 | 24.3 | 48 | 201 |
| 11 | Hot Rod Williams | CLE | 2.3 | 80 | 30.4 | 60 | 182 |
| 12 |
 Chris Dudley |
NJN | 2.2 | 82 | 23.2 | 38 | 179 |
| 13 |
 Elden Campbell |
LAL | 2.0 | 81 | 23.2 | 53 | 159 |
| 14 |
 Shawn Kemp |
SEA | 1.9 | 64 | 28.3 | 70 | 124 |
| 15 |
 Benoit Benjamin |
SEA | 1.9 | 63 | 30.8 | 39 | 118 |
| 16 | Lionel Simmons | SAC | 1.7 | 78 | 37.1 | 135 | 132 |
| 17 |
 Sam Bowie |
NJN | 1.7 | 71 | 30.7 | 41 | 120 |
| 18 |
 Horace Grant |
CHI | 1.6 | 81 | 35.3 | 100 | 131 |
| 19 |
 Rony Seikaly |
MIA | 1.5 | 79 | 35.4 | 40 | 121 |
| 20 | John Salley | DET | 1.5 | 72 | 24.6 | 49 | 110 |
| 21 |
 Derrick Coleman |
NJN | 1.5 | 65 | 34.0 | 54 | 98 |
| 22 | Danny Manning | LAC | 1.5 | 82 | 35.4 | 135 | 122 |
| 23 | Randy Breuer | MIN | 1.5 | 67 | 17.6 | 27 | 99 |
| 24 | Tim Perry | PHX | 1.5 | 80 | 31.0 | 44 | 116 |
| 25 |
 Thurl Bailey |
MIN | 1.4 | 84 | 25.0 | 35 | 117 |
| 26 | Rik Smits | IND | 1.4 | 74 | 23.9 | 29 | 100 |
| 27 |
 Herb Williams |
DAL | 1.3 | 75 | 27.2 | 35 | 98 |
| 28 | Clifford Robinson | POR | 1.3 | 82 | 25.9 | 85 | 107 |
| 29 | Felton Spencer | MIN | 1.3 | 61 | 24.3 | 27 | 79 |
| 30 |
 Reggie Lewis |
BOS | 1.3 | 82 | 37.4 | 125 | 105 |
| 31 |
 Robert Parish |
BOS | 1.2 | 79 | 28.9 | 68 | 97 |
| 32 |
 Charles Jones |
WAS | 1.2 | 75 | 18.2 | 43 | 92 |
| 33 | Antoine Carr | SAN | 1.2 | 81 | 23.0 | 32 | 96 |
| 34 |
 Dale Davis |
IND | 1.2 | 64 | 20.3 | 27 | 74 |
| 35 |
 Scottie Pippen |
CHI | 1.1 | 82 | 38.6 | 155 | 93 |
| 36 |
 Wayman Tisdale |
SAC | 1.1 | 72 | 35.0 | 55 | 79 |
| 37 | Brad Daugherty | CLE | 1.1 | 73 | 36.2 | 65 | 78 |
| 38 |
 Chris Morris |
NJN | 1.1 | 77 | 31.1 | 129 | 81 |
| 39 |
 Armen Gilliam |
PHL | 1.0 | 81 | 34.2 | 51 | 85 |
| 40 | Brad Lohaus | MIL | 1.0 | 70 | 15.4 | 40 | 71 |
| 41 | Mark West | PHX | 1.0 | 82 | 17.5 | 14 | 81 |
| 42 | Sam Perkins | LAL | 1.0 | 63 | 37.0 | 64 | 62 |
| 43 | Luc Longley | MIN | 1.0 | 66 | 15.0 | 35 | 64 |
| 44 |
 Michael Jordan |
CHI | 0.9 | 80 | 38.8 | 182 | 75 |
| 45 |
 Jerome Kersey |
POR | 0.9 | 77 | 33.2 | 114 | 71 |
| 46 |
 Clyde Drexler |
POR | 0.9 | 76 | 36.2 | 138 | 70 |
| 47 |
 Ron Harper |
LAC | 0.9 | 82 | 38.3 | 152 | 72 |
| 48 | Jon Koncak | ATL | 0.9 | 77 | 19.3 | 50 | 67 |
| 49 | Ken Norman | LAC | 0.9 | 77 | 26.1 | 53 | 66 |
| 50 |
 Dennis Rodman |
DET | 0.9 | 82 | 40.3 | 68 | 70 |
1–50 of 228Next →