

1999-2000 NBA Effective FG Percentage Leaders
Field goal percentage weighting threes
Brent Barry led the NBA in effective fg percentage in 1999-2000 with 57.9%, 0.5 percentage points ahead of Shaquille O'Neal (57.4%). It was one of 2 times Brent Barry led in effective fg percentage.
Showing players who met the games-played minimum for the season. Show all players
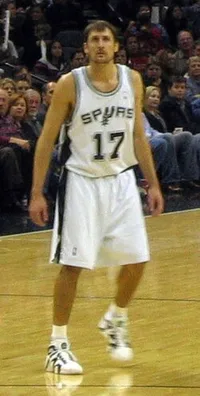 Led the NBA in 1999-2000
Brent Barry
SEA
57.9%
Effective FG Percentage
0.5% clear of Shaquille O'Neal
Showing Effective FG Percentage and the stats that give it context
Full stat line
| # | Player | Team | eFG% | GP | FGM | FGA | FG% |
|---|---|---|---|---|---|---|---|
| 1 |
 Brent Barry |
SEA | 57.9% | 80 | 327 | 707 | 46.3% |
| 2 |
 Shaquille O'Neal |
LAL | 57.4% | 79 | 956 | 1,665 | 57.4% |
| 3 |
 Dikembe Mutombo |
ATL | 56.2% | 82 | 322 | 573 | 56.2% |
| 4 | Rodney Rogers | PHX | 55.1% | 82 | 428 | 881 | 48.6% |
| 5 |
 Alonzo Mourning |
MIA | 55.1% | 79 | 652 | 1,184 | 55.1% |
| 6 |
 Ruben Patterson |
SEA | 54.5% | 81 | 354 | 661 | 53.6% |
| 7 |
 Jeff Hornacek |
UTA | 53.7% | 77 | 358 | 728 | 49.2% |
| 8 | Walt Williams | HOU | 53.3% | 76 | 312 | 681 | 45.8% |
| 9 |
 Wally Szczerbiak |
MIN | 53.2% | 73 | 342 | 669 | 51.1% |
| 10 |
 John Stockton |
UTA | 53.0% | 82 | 363 | 725 | 50.1% |
| 11 |
 Reggie Miller |
IND | 52.7% | 81 | 466 | 1,041 | 44.8% |
| 12 |
 Allan Houston |
NYK | 52.5% | 82 | 614 | 1,271 | 48.3% |
| 13 |
 Shandon Anderson |
HOU | 52.4% | 82 | 368 | 778 | 47.3% |
| 14 |
 Rasheed Wallace |
POR | 52.2% | 81 | 542 | 1,045 | 51.9% |
| 15 |
 Steven Smith |
POR | 52.0% | 82 | 420 | 900 | 46.7% |
| 16 |
 Lindsey Hunter |
DET | 51.9% | 82 | 379 | 892 | 42.5% |
| 17 |
 Peja Stojakovic |
SAC | 51.7% | 74 | 321 | 717 | 44.8% |
| 18 | Clifford Robinson | PHX | 51.7% | 80 | 530 | 1,142 | 46.4% |
| 19 |
 Ray Allen |
MIL | 51.6% | 82 | 642 | 1,411 | 45.5% |
| 20 |
 Dirk Nowitzki |
DAL | 51.3% | 82 | 515 | 1,118 | 46.1% |
| 21 |
 David Robinson |
SAS | 51.2% | 80 | 528 | 1,031 | 51.2% |
| 22 | Bob Sura | CLE | 51.2% | 73 | 356 | 815 | 43.7% |
| 23 |
 Karl Malone |
UTA | 51.0% | 82 | 752 | 1,476 | 50.9% |
| 24 |
 Kevin Garnett |
MIN | 50.7% | 81 | 759 | 1,526 | 49.7% |
| 25 |
 Vlade Divac |
SAC | 50.7% | 82 | 384 | 764 | 50.3% |
| 26 |
 Antonio McDyess |
DEN | 50.7% | 81 | 614 | 1,211 | 50.7% |
| 27 |
 Othella Harrington |
VAN | 50.6% | 82 | 420 | 830 | 50.6% |
| 28 | Bryon Russell | UTA | 50.4% | 82 | 408 | 914 | 44.6% |
| 29 |
 Jalen Rose |
IND | 50.3% | 80 | 563 | 1,196 | 47.1% |
| 30 |
 Tim Thomas |
MIL | 50.3% | 80 | 347 | 753 | 46.1% |
| 31 |
 Glenn Robinson |
MIL | 50.2% | 81 | 690 | 1,461 | 47.2% |
| 32 |
 Gary Payton |
SEA | 50.2% | 82 | 747 | 1,666 | 44.8% |
| 33 |
 Grant Hill |
DET | 50.1% | 74 | 696 | 1,422 | 48.9% |
| 34 |
 Scottie Pippen |
POR | 50.1% | 82 | 388 | 860 | 45.1% |
| 35 |
 Corliss Williamson |
SAC | 50.0% | 76 | 311 | 622 | 50.0% |
| 36 | Anthony Peeler | MIN | 49.4% | 82 | 316 | 725 | 43.6% |
| 37 |
 Anfernee Hardaway |
PHX | 49.4% | 60 | 378 | 798 | 47.4% |
| 38 |
 Darrell Armstrong |
ORL | 49.4% | 82 | 484 | 1,119 | 43.3% |
| 39 | Jamal Mashburn | MIA | 49.3% | 76 | 515 | 1,158 | 44.5% |
| 40 |
 Steve Francis |
HOU | 49.3% | 77 | 497 | 1,117 | 44.5% |
| 41 |
 Vince Carter |
TOR | 49.3% | 82 | 788 | 1,696 | 46.5% |
| 42 |
 Chris Webber |
SAC | 49.2% | 75 | 748 | 1,548 | 48.3% |
| 43 |
 Terrell Brandon |
MIN | 49.2% | 71 | 486 | 1,042 | 46.6% |
| 44 |
 Tim Duncan |
SAS | 49.1% | 74 | 628 | 1,281 | 49.0% |
| 45 |
 Kobe Bryant |
LAL | 48.8% | 66 | 554 | 1,183 | 46.8% |
| 46 |
 Michael Finley |
DAL | 48.7% | 82 | 748 | 1,636 | 45.7% |
| 47 |
 Paul Pierce |
BOS | 48.6% | 73 | 486 | 1,099 | 44.2% |
| 48 | Tyrone Hill | PHI | 48.5% | 68 | 318 | 656 | 48.5% |
| 49 |
 Eddie Jones |
CHH | 48.4% | 72 | 478 | 1,119 | 42.7% |
| 50 | Rik Smits | IND | 48.4% | 79 | 431 | 890 | 48.4% |
1–50 of 107Next →