

2001-2002 NBA Effective FG Percentage Leaders
Field goal percentage weighting threes
Brent Barry led the NBA in effective fg percentage in 2001-2002 with 61.1%, 3.2 percentage points ahead of Shaquille O'Neal (57.9%). It was one of 2 times Brent Barry led in effective fg percentage.
Showing players who met the games-played minimum for the season. Show all players
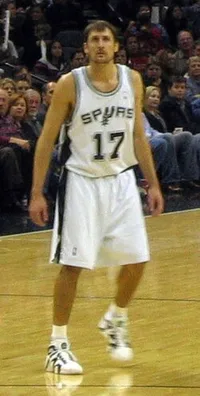 Led the NBA in 2001-2002
Brent Barry
SEA
61.1%
Effective FG Percentage
3.2% clear of Shaquille O'Neal
Showing Effective FG Percentage and the stats that give it context
Full stat line
| # | Player | Team | eFG% | GP | FGM | FGA | FG% |
|---|---|---|---|---|---|---|---|
| 1 |
 Brent Barry |
SEA | 61.1% | 81 | 401 | 790 | 50.8% |
| 2 |
 Shaquille O'Neal |
LAL | 57.9% | 67 | 712 | 1,229 | 57.9% |
| 3 |
 Wesley Person |
CLE | 57.0% | 78 | 467 | 944 | 49.5% |
| 4 |
 Ray Allen |
MIL | 56.1% | 69 | 530 | 1,148 | 46.2% |
| 5 |
 Steve Nash |
DAL | 55.4% | 82 | 525 | 1,088 | 48.3% |
| 6 |
 Chucky Atkins |
DET | 55.3% | 79 | 368 | 790 | 46.6% |
| 7 |
 Reggie Miller |
IND | 55.2% | 79 | 414 | 913 | 45.3% |
| 8 |
 Wally Szczerbiak |
MIN | 54.4% | 82 | 609 | 1,200 | 50.8% |
| 9 |
 Peja Stojakovic |
SAC | 54.1% | 71 | 547 | 1,130 | 48.4% |
| 10 |
 Steven Smith |
SAS | 54.0% | 77 | 310 | 682 | 45.5% |
| 11 |
 Pat Garrity |
ORL | 53.7% | 80 | 327 | 767 | 42.6% |
| 12 |
 John Stockton |
UTA | 53.4% | 82 | 401 | 775 | 51.7% |
| 13 |
 Dirk Nowitzki |
DAL | 53.2% | 76 | 600 | 1,258 | 47.7% |
| 14 |
 Rashard Lewis |
SEA | 53.1% | 71 | 455 | 972 | 46.8% |
| 15 | Rodney Rogers | BOS | 52.9% | 77 | 356 | 756 | 47.1% |
| 16 |
 Donyell Marshall |
UTA | 52.9% | 58 | 343 | 661 | 51.9% |
| 17 |
 Elton Brand |
LAC | 52.7% | 80 | 532 | 1,010 | 52.7% |
| 18 |
 Ruben Patterson |
POR | 52.3% | 75 | 319 | 619 | 51.5% |
| 19 |
 Doug Christie |
SAC | 52.1% | 81 | 338 | 735 | 46.0% |
| 20 |
 Pau Gasol |
MEM | 51.8% | 82 | 551 | 1,064 | 51.8% |
| 21 | Kerry Kittles | NJN | 51.8% | 82 | 438 | 940 | 46.6% |
| 22 |
 Alonzo Mourning |
MIA | 51.7% | 75 | 447 | 866 | 51.6% |
| 23 |
 Raef LaFrentz |
DAL | 51.4% | 78 | 421 | 920 | 45.8% |
| 24 |
 Rasheed Wallace |
POR | 51.3% | 79 | 603 | 1,287 | 46.9% |
| 25 |
 Corliss Williamson |
DET | 51.1% | 78 | 411 | 806 | 51.0% |
| 26 |
 Mike Miller |
ORL | 51.0% | 63 | 351 | 802 | 43.8% |
| 27 |
 Tim Duncan |
SAS | 50.8% | 82 | 764 | 1,504 | 50.8% |
| 28 |
 Paul Pierce |
BOS | 50.8% | 82 | 707 | 1,598 | 44.2% |
| 29 |
 David Robinson |
SAS | 50.7% | 78 | 341 | 672 | 50.7% |
| 30 | Anthony Mason | MIL | 50.6% | 82 | 316 | 626 | 50.5% |
| 31 |
 Quentin Richardson |
LAC | 50.4% | 81 | 400 | 926 | 43.2% |
| 32 |
 Darrell Armstrong |
ORL | 50.3% | 82 | 347 | 828 | 41.9% |
| 33 |
 Brad Miller |
IND | 50.1% | 76 | 366 | 733 | 49.9% |
| 34 |
 Dikembe Mutombo |
PHI | 50.1% | 80 | 321 | 641 | 50.1% |
| 35 |
 Bonzi Wells |
POR | 50.0% | 74 | 487 | 1,039 | 46.9% |
| 36 |
 Jason Terry |
ATL | 50.0% | 78 | 524 | 1,219 | 43.0% |
| 37 |
 Chauncey Billups |
MIN | 49.8% | 82 | 348 | 823 | 42.3% |
| 38 |
 Chris Webber |
SAC | 49.7% | 54 | 532 | 1,075 | 49.5% |
| 39 |
 Bobby Jackson |
SAC | 49.5% | 81 | 334 | 754 | 44.3% |
| 40 |
 Michael Finley |
DAL | 49.4% | 69 | 569 | 1,228 | 46.3% |
| 41 |
 Kurt Thomas |
NYK | 49.4% | 82 | 463 | 938 | 49.4% |
| 42 |
 Eddie Jones |
MIA | 49.4% | 81 | 517 | 1,198 | 43.2% |
| 43 |
 Rasho Nesterovic |
MIN | 49.3% | 82 | 324 | 657 | 49.3% |
| 44 | Cuttino Mobley | HOU | 49.3% | 74 | 595 | 1,358 | 43.8% |
| 45 |
 Glenn Robinson |
MIL | 49.3% | 66 | 536 | 1,147 | 46.7% |
| 46 |
 Sam Cassell |
MIL | 49.2% | 74 | 554 | 1,197 | 46.3% |
| 47 |
 Morris Peterson |
TOR | 49.2% | 63 | 336 | 768 | 43.8% |
| 48 |
 Gary Payton |
SEA | 49.0% | 82 | 737 | 1,578 | 46.7% |
| 49 | Keon Clark | TOR | 49.0% | 81 | 380 | 775 | 49.0% |
| 50 |
 Allan Houston |
NYK | 48.9% | 77 | 568 | 1,301 | 43.7% |
1–50 of 108Next →