

1977-1978 NBA Field Goal Percentage Leaders
Share of field goals made
Bobby Jones led the NBA in field goal percentage in 1977-1978 with 57.8%, 0.3 percentage points ahead of Darryl Dawkins (57.5%).
Showing players who met the games-played minimum for the season. Show all players
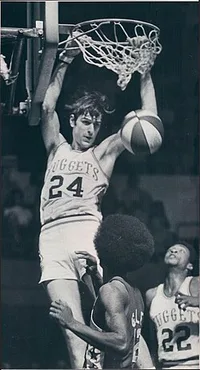 Led the NBA in 1977-1978
Bobby Jones
DEN
57.8%
Field Goal Percentage
0.3% clear of Darryl Dawkins
Showing Field Goal Percentage and the stats that give it context
Full stat line
| # | Player | Team | FG% | GP | FGM | FGA |
|---|---|---|---|---|---|---|
| 1 |
 Bobby Jones |
DEN | 57.8% | 75 | 440 | 761 |
| 2 |
 Darryl Dawkins |
PHL | 57.5% | 70 | 332 | 577 |
| 3 |
 Artis Gilmore |
CHI | 55.9% | 82 | 704 | 1,260 |
| 4 |
 Kareem Abdul-Jabbar |
LAL | 55.0% | 62 | 663 | 1,205 |
| 5 |
 Alex English |
MIL | 54.2% | 82 | 343 | 633 |
| 6 |
 Bob Lanier |
DET | 53.7% | 63 | 622 | 1,159 |
| 7 |
 George Gervin |
SAN | 53.6% | 82 | 864 | 1,611 |
| 8 |
 Bob Gross |
POR | 52.9% | 72 | 381 | 720 |
| 9 | Billy Paultz | SAN | 52.9% | 80 | 518 | 979 |
| 10 |
 Walter Davis |
PHX | 52.6% | 81 | 786 | 1,494 |
| 11 |
 Doug Collins |
PHL | 52.6% | 79 | 643 | 1,223 |
| 12 |
 Marques Johnson |
MIL | 52.2% | 80 | 628 | 1,204 |
| 13 |
 Bill Walton |
POR | 52.2% | 58 | 460 | 882 |
| 14 |
 David Thompson |
DEN | 52.1% | 80 | 826 | 1,584 |
| 15 |
 Bob McAdoo |
NYK | 52.0% | 79 | 814 | 1,564 |
| 16 | Sonny Parker | GOS | 51.9% | 82 | 406 | 783 |
| 17 |
 Paul Westphal |
PHX | 51.6% | 80 | 809 | 1,568 |
| 18 |
 Lonnie Shelton |
NYK | 51.4% | 82 | 508 | 988 |
| 19 |
 Adrian Dantley |
LAL | 51.2% | 79 | 578 | 1,128 |
| 20 |
 Dan Issel |
DEN | 51.2% | 82 | 659 | 1,287 |
| 21 |
 Mitch Kupchak |
WAS | 51.2% | 67 | 393 | 768 |
| 22 |
 Scott Wedman |
KCK | 50.9% | 81 | 607 | 1,192 |
| 23 |
 Lou Dampier |
SAN | 50.9% | 82 | 336 | 660 |
| 24 | Rich Kelley | NOJ | 50.5% | 82 | 304 | 602 |
| 25 |
 Swen Nater |
BUF | 50.4% | 78 | 501 | 994 |
| 26 |
 Junior Bridgeman |
MIL | 50.3% | 82 | 476 | 947 |
| 27 |
 Julius Erving |
PHL | 50.2% | 74 | 611 | 1,217 |
| 28 | Marvin Webster | SEA | 50.2% | 82 | 427 | 851 |
| 29 | Butch Beard | NYK | 50.2% | 79 | 308 | 614 |
| 30 | Eric Money | DET | 50.0% | 76 | 600 | 1,200 |
| 31 |
 Moses Malone |
HOU | 49.9% | 59 | 413 | 828 |
| 32 | Aaron James | NOJ | 49.7% | 80 | 428 | 861 |
| 33 |
 Norm Nixon |
LAL | 49.7% | 81 | 496 | 998 |
| 34 |
 Lou Hudson |
LAL | 49.7% | 82 | 493 | 992 |
| 35 |
 Elmore Smith |
CLE | 49.7% | 81 | 402 | 809 |
| 36 |
 Gail Goodrich |
NOJ | 49.5% | 81 | 520 | 1,050 |
| 37 |
 Earl Monroe |
NYK | 49.5% | 76 | 556 | 1,123 |
| 38 |
 Billy Knight |
BUF | 49.4% | 53 | 457 | 926 |
| 39 |
 Otis Birdsong |
KCK | 49.2% | 73 | 470 | 955 |
| 40 |
 Calvin Murphy |
HOU | 49.1% | 76 | 852 | 1,737 |
| 41 |
 Dave Cowens |
BOS | 49.0% | 77 | 598 | 1,220 |
| 42 |
 Tom Owens |
POR | 49.0% | 82 | 313 | 639 |
| 43 | Larry Kenon | SAN | 48.9% | 81 | 698 | 1,426 |
| 44 |
 Dan Roundfield |
IND | 48.9% | 79 | 421 | 861 |
| 45 |
 John Gianelli |
MIL | 48.8% | 82 | 307 | 629 |
| 46 |
 Fred Brown |
SEA | 48.8% | 72 | 508 | 1,042 |
| 47 |
 Alvan Adams |
PHX | 48.5% | 70 | 434 | 895 |
| 48 |
 Eddie Johnson |
ATL | 48.4% | 79 | 332 | 686 |
| 49 | Spencer Haywood | NYK | 48.4% | 67 | 412 | 852 |
| 50 | John Mengelt | CHI | 48.1% | 81 | 325 | 675 |
1–50 of 103Next →