

1978-1979 NBA Effective FG Percentage Leaders
Field goal percentage weighting threes
Cedric Maxwell led the NBA in effective fg percentage in 1978-1979 with 58.4%, 0.7 percentage points ahead of Kareem Abdul-Jabbar (57.7%). It was one of 2 times Cedric Maxwell led in effective fg percentage.
Showing players who met the games-played minimum for the season. Show all players
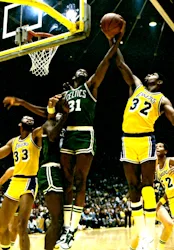 Led the NBA in 1978-1979
Cedric Maxwell
BOS
58.4%
Effective FG Percentage
0.7% clear of Kareem Abdul-Jabbar
Showing Effective FG Percentage and the stats that give it context
Full stat line
| # | Player | Team | eFG% | GP | FGM | FGA | FG% |
|---|---|---|---|---|---|---|---|
| 1 |
 Cedric Maxwell |
BOS | 58.4% | 80 | 472 | 808 | 58.4% |
| 2 |
 Kareem Abdul-Jabbar |
LAL | 57.7% | 80 | 777 | 1,347 | 57.7% |
| 3 |
 Wes Unseld |
WAS | 57.7% | 77 | 346 | 600 | 57.7% |
| 4 |
 Artis Gilmore |
CHI | 57.5% | 82 | 753 | 1,310 | 57.5% |
| 5 |
 Swen Nater |
SDC | 56.9% | 79 | 357 | 627 | 56.9% |
| 6 |
 Kermit Washington |
SDC | 56.2% | 82 | 350 | 623 | 56.2% |
| 7 |
 Walter Davis |
PHX | 56.1% | 79 | 764 | 1,362 | 56.1% |
| 8 |
 Marques Johnson |
MIL | 55.0% | 77 | 820 | 1,491 | 55.0% |
| 9 | Bill Robinzine | KCK | 54.8% | 82 | 459 | 837 | 54.8% |
| 10 |
 Tom Owens |
POR | 54.8% | 82 | 600 | 1,095 | 54.8% |
| 11 |
 Norm Nixon |
LAL | 54.2% | 82 | 623 | 1,149 | 54.2% |
| 12 |
 George Gervin |
SAN | 54.1% | 80 | 947 | 1,749 | 54.1% |
| 13 |
 Moses Malone |
HOU | 54.0% | 82 | 716 | 1,325 | 54.0% |
| 14 |
 Mitch Kupchak |
WAS | 53.9% | 66 | 369 | 685 | 53.9% |
| 15 |
 Bobby Jones |
PHL | 53.7% | 80 | 378 | 704 | 53.7% |
| 16 |
 Paul Westphal |
PHX | 53.5% | 81 | 801 | 1,496 | 53.5% |
| 17 |
 Scott Wedman |
KCK | 53.4% | 73 | 561 | 1,050 | 53.4% |
| 18 |
 Tom Boswell |
DEN | 53.2% | 79 | 321 | 603 | 53.2% |
| 19 |
 Alvan Adams |
PHX | 53.0% | 77 | 569 | 1,073 | 53.0% |
| 20 | Billy Paultz | SAN | 52.6% | 79 | 399 | 758 | 52.6% |
| 21 |
 Bernard King |
NJN | 52.2% | 82 | 710 | 1,359 | 52.2% |
| 22 |
 Lonnie Shelton |
SEA | 51.9% | 76 | 446 | 859 | 51.9% |
| 23 | Toby Knight | NYK | 51.9% | 82 | 609 | 1,174 | 51.9% |
| 24 |
 Kent Benson |
MIL | 51.8% | 82 | 413 | 798 | 51.8% |
| 25 |
 Darryl Dawkins |
PHL | 51.7% | 78 | 430 | 831 | 51.7% |
| 26 |
 Lou Hudson |
LAL | 51.7% | 78 | 329 | 636 | 51.7% |
| 27 |
 Rudy Tomjanovich |
HOU | 51.7% | 74 | 620 | 1,200 | 51.7% |
| 28 |
 Dan Issel |
DEN | 51.7% | 81 | 532 | 1,030 | 51.7% |
| 29 |
 Bob Lanier |
DET | 51.5% | 53 | 489 | 950 | 51.5% |
| 30 | M.L. Carr | DET | 51.4% | 80 | 587 | 1,143 | 51.4% |
| 31 |
 Mike Mitchell |
CLE | 51.3% | 80 | 362 | 706 | 51.3% |
| 32 |
 David Thompson |
DEN | 51.2% | 76 | 693 | 1,353 | 51.2% |
| 33 |
 Alex English |
IND | 51.1% | 81 | 563 | 1,102 | 51.1% |
| 34 |
 Adrian Dantley |
LAL | 51.0% | 60 | 374 | 733 | 51.0% |
| 35 |
 Eddie Johnson |
ATL | 51.0% | 78 | 501 | 982 | 51.0% |
| 36 |
 Otis Birdsong |
KCK | 50.9% | 82 | 741 | 1,456 | 50.9% |
| 37 |
 Junior Bridgeman |
MIL | 50.6% | 82 | 540 | 1,067 | 50.6% |
| 38 | Rich Kelley | NOJ | 50.6% | 80 | 440 | 870 | 50.6% |
| 39 | James Silas | SAN | 50.5% | 79 | 466 | 922 | 50.5% |
| 40 |
 Dan Roundfield |
ATL | 50.4% | 80 | 462 | 916 | 50.4% |
| 41 | Larry Kenon | SAN | 50.4% | 81 | 748 | 1,484 | 50.4% |
| 42 |
 Jamaal Wilkes |
LAL | 50.4% | 82 | 626 | 1,242 | 50.4% |
| 43 | Sonny Parker | GOS | 50.2% | 79 | 512 | 1,019 | 50.2% |
| 44 |
 Sam Lacey |
KCK | 50.2% | 82 | 350 | 697 | 50.2% |
| 45 |
 James Edwards |
IND | 50.1% | 82 | 534 | 1,065 | 50.1% |
| 46 |
 Phil Smith |
GOS | 50.1% | 59 | 489 | 977 | 50.1% |
| 47 |
 Doug Collins |
PHL | 49.9% | 47 | 358 | 717 | 49.9% |
| 48 | Bob Dandridge | WAS | 49.9% | 78 | 629 | 1,260 | 49.9% |
| 49 |
 Robert Parish |
GOS | 49.9% | 76 | 554 | 1,110 | 49.9% |
| 50 |
 Calvin Murphy |
HOU | 49.6% | 82 | 707 | 1,424 | 49.6% |
1–50 of 107Next →