

1978-1979 NBA Free Throw Percentage Leaders
Share of free throws made
Rick Barry led the NBA in free throw percentage in 1978-1979 with 94.7%, 1.9 percentage points ahead of Calvin Murphy (92.8%). It stands 8th among all single seasons in NBA history. It was one of 6 times Rick Barry led in free throw percentage.
Showing players who met the games-played minimum for the season. Show all players
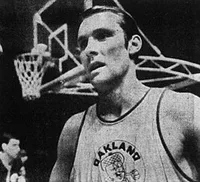 Led the NBA in 1978-1979
Rick Barry
HOU
94.7%
Free Throw Percentage
1.9% clear of Calvin Murphy
Showing Free Throw Percentage and the stats that give it context
Full stat line
| # | Player | Team | FT% | GP | FGM | FGA | FG% |
|---|---|---|---|---|---|---|---|
| 1 |
 Rick Barry |
HOU | 94.7% | 80 | 461 | 1,000 | 46.1% |
| 2 |
 Calvin Murphy |
HOU | 92.8% | 82 | 707 | 1,424 | 49.6% |
| 3 |
 Fred Brown |
SEA | 88.8% | 77 | 446 | 951 | 46.9% |
| 4 | Robert Smith | DEN | 88.3% | 82 | 184 | 436 | 42.2% |
| 5 |
 Ricky Sobers |
IND | 88.2% | 81 | 553 | 1,194 | 46.3% |
| 6 |
 Dave Twardzik |
POR | 87.3% | 64 | 203 | 381 | 53.3% |
| 7 |
 Mike Newlin |
HOU | 87.2% | 76 | 283 | 581 | 48.7% |
| 8 | Mike Dunleavy | HOU | 86.4% | 74 | 215 | 425 | 50.6% |
| 9 | Brian Winters | MIL | 85.6% | 79 | 662 | 1,343 | 49.3% |
| 10 | Armond Hill | ATL | 85.4% | 82 | 296 | 682 | 43.4% |
| 11 |
 Adrian Dantley |
LAL | 85.4% | 60 | 374 | 733 | 51.0% |
| 12 | John Williamson | NJN | 85.4% | 74 | 635 | 1,367 | 46.5% |
| 13 |
 Gail Goodrich |
NOJ | 85.3% | 74 | 382 | 850 | 44.9% |
| 14 | Larry Kenon | SAN | 84.5% | 81 | 748 | 1,484 | 50.4% |
| 15 |
 Pete Maravich |
NOJ | 84.1% | 49 | 436 | 1,035 | 42.1% |
| 16 |
 Earl Monroe |
NYK | 83.8% | 64 | 329 | 699 | 47.1% |
| 17 |
 Paul Westphal |
PHX | 83.7% | 81 | 801 | 1,496 | 53.5% |
| 18 |
 Eddie Johnson |
ATL | 83.2% | 78 | 501 | 982 | 51.0% |
| 19 |
 Walter Davis |
PHX | 83.1% | 79 | 764 | 1,362 | 56.1% |
| 20 | James Silas | SAN | 83.1% | 79 | 466 | 922 | 50.5% |
| 21 | Mickey Johnson | CHI | 83.0% | 82 | 496 | 1,105 | 44.9% |
| 22 |
 Junior Bridgeman |
MIL | 82.9% | 82 | 540 | 1,067 | 50.6% |
| 23 | John Long | DET | 82.6% | 82 | 581 | 1,240 | 46.9% |
| 24 |
 George Gervin |
SAN | 82.6% | 80 | 947 | 1,749 | 54.1% |
| 25 | Bob Dandridge | WAS | 82.5% | 78 | 629 | 1,260 | 49.9% |
| 26 | John Mengelt | CHI | 82.4% | 75 | 338 | 689 | 49.1% |
| 27 |
 John Lucas |
GOS | 82.2% | 82 | 530 | 1,146 | 46.2% |
| 28 |
 Ron Brewer |
POR | 82.0% | 81 | 434 | 878 | 49.4% |
| 29 | Mike Bratz | PHX | 81.8% | 77 | 242 | 533 | 45.4% |
| 30 |
 Austin Carr |
CLE | 81.6% | 82 | 551 | 1,161 | 47.5% |
| 31 | Rich Kelley | NOJ | 81.4% | 80 | 440 | 870 | 50.6% |
| 32 |
 Jack Sikma |
SEA | 81.4% | 82 | 476 | 1,034 | 46.0% |
| 33 |
 Doug Collins |
PHL | 81.4% | 47 | 358 | 717 | 49.9% |
| 34 |
 Randy Smith |
SDC | 81.3% | 82 | 693 | 1,523 | 45.5% |
| 35 |
 Phil Ford |
KCK | 81.3% | 79 | 467 | 1,004 | 46.5% |
| 36 |
 Dave Cowens |
BOS | 80.7% | 68 | 488 | 1,010 | 48.3% |
| 37 |
 Mark Olberding |
SAN | 80.3% | 80 | 261 | 551 | 47.4% |
| 38 |
 Ray Williams |
NYK | 80.2% | 81 | 575 | 1,257 | 45.7% |
| 39 |
 Cedric Maxwell |
BOS | 80.2% | 80 | 472 | 808 | 58.4% |
| 40 | Wilbur Holland | CHI | 80.1% | 82 | 445 | 940 | 47.3% |
| 41 |
 Steve Mix |
PHL | 80.1% | 74 | 265 | 493 | 53.8% |
| 42 |
 Swen Nater |
SDC | 80.0% | 79 | 357 | 627 | 56.9% |
| 43 | Tom Henderson | WAS | 80.0% | 70 | 299 | 641 | 46.6% |
| 44 |
 Alvan Adams |
PHX | 79.9% | 77 | 569 | 1,073 | 53.0% |
| 45 |
 Jan Van Breda Kolff |
NJN | 79.8% | 80 | 196 | 423 | 46.3% |
| 46 |
 Campy Russell |
CLE | 79.7% | 74 | 603 | 1,268 | 47.6% |
| 47 |
 Scott Wedman |
KCK | 79.7% | 73 | 561 | 1,050 | 53.4% |
| 48 | Billy McKinney | KCK | 79.6% | 78 | 240 | 477 | 50.3% |
| 49 |
 Tom Owens |
POR | 79.4% | 82 | 600 | 1,095 | 54.8% |
| 50 |
 Henry Bibby |
PHL | 79.4% | 82 | 368 | 869 | 42.3% |
1–50 of 115Next →