

2006-2007 NBA Three-Point Percentage Leaders
Share of three-pointers made
Jason Kapono led the NBA in three-point percentage in 2006-2007 with 51.4%, 5.9 percentage points ahead of Steve Nash (45.5%). It stands 4th among all single seasons in NBA history.
Showing players who met the games-played minimum for the season. Show all players
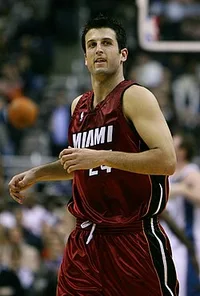 Led the NBA in 2006-2007
Jason Kapono
MIA
51.4%
Three-Point Percentage
5.9% clear of Steve Nash
Showing Three-Point Percentage and the stats that give it context
Full stat line
| # | Player | Team | 3P% | GP | FGM | FGA | FG% |
|---|---|---|---|---|---|---|---|
| 1 |
 Jason Kapono |
MIA | 51.4% | 67 | 278 | 563 | 49.4% |
| 2 |
 Steve Nash |
PHX | 45.5% | 76 | 517 | 971 | 53.2% |
| 3 |
 Brent Barry |
SAS | 44.6% | 75 | 202 | 425 | 47.5% |
| 4 |
 Luther Head |
HOU | 44.1% | 80 | 306 | 700 | 43.7% |
| 5 |
 Anthony Parker |
TOR | 44.1% | 73 | 328 | 687 | 47.7% |
| 6 |
 Jason Terry |
DAL | 43.8% | 81 | 514 | 1,063 | 48.4% |
| 7 |
 Leandro Barbosa |
PHX | 43.4% | 80 | 529 | 1,111 | 47.6% |
| 8 |
 Al Harrington |
GSW | 43.3% | 78 | 495 | 1,083 | 45.7% |
| 9 |
 Kyle Korver |
PHI | 43.0% | 74 | 372 | 845 | 44.0% |
| 10 |
 Bostjan Nachbar |
NJN | 42.3% | 76 | 226 | 495 | 45.7% |
| 11 |
 Shane Battier |
HOU | 42.1% | 82 | 292 | 654 | 44.6% |
| 12 |
 Matt Carroll |
CHA | 41.6% | 72 | 285 | 658 | 43.3% |
| 13 |
 Kirk Hinrich |
CHI | 41.5% | 80 | 475 | 1,061 | 44.8% |
| 14 |
 Ben Gordon |
CHI | 41.3% | 82 | 609 | 1,338 | 45.5% |
| 15 |
 Raja Bell |
PHX | 41.3% | 78 | 410 | 950 | 43.2% |
| 16 | Cuttino Mobley | LAC | 41.1% | 78 | 388 | 882 | 44.0% |
| 17 |
 Ime Udoka |
POR | 40.6% | 75 | 237 | 514 | 46.1% |
| 18 |
 Mike Miller |
MEM | 40.6% | 70 | 465 | 1,010 | 46.0% |
| 19 |
 Earl Boykins |
MIL | 39.7% | 66 | 323 | 769 | 42.0% |
| 20 |
 Ricky Davis |
MIN | 39.7% | 81 | 506 | 1,089 | 46.5% |
| 21 |
 Manu Ginobili |
SAS | 39.6% | 75 | 396 | 854 | 46.4% |
| 22 |
 Rashard Lewis |
SEA | 39.0% | 60 | 463 | 1,005 | 46.1% |
| 23 |
 JR Smith |
DEN | 39.0% | 63 | 284 | 644 | 44.1% |
| 24 |
 Nate Robinson |
NYK | 39.0% | 64 | 227 | 523 | 43.4% |
| 25 |
 Paul Pierce |
BOS | 38.9% | 47 | 373 | 850 | 43.9% |
| 26 |
 Hedo Turkoglu |
ORL | 38.8% | 73 | 345 | 823 | 41.9% |
| 27 |
 Mickael Pietrus |
GSW | 38.8% | 72 | 286 | 586 | 48.8% |
| 28 |
 Damon Jones |
CLE | 38.5% | 60 | 137 | 355 | 38.6% |
| 29 |
 Josh Howard |
DAL | 38.5% | 70 | 493 | 1,075 | 45.9% |
| 30 |
 Mehmet Okur |
UTA | 38.4% | 80 | 490 | 1,061 | 46.2% |
| 31 |
 Bruce Bowen |
SAS | 38.4% | 82 | 189 | 467 | 40.5% |
| 32 |
 Michael Redd |
MIL | 38.2% | 53 | 477 | 1,025 | 46.5% |
| 33 |
 Tim Thomas |
LAC | 38.2% | 76 | 299 | 723 | 41.4% |
| 34 |
 Danny Granger |
IND | 38.2% | 82 | 398 | 868 | 45.9% |
| 35 |
 Joe Johnson |
ATL | 38.1% | 57 | 536 | 1,139 | 47.1% |
| 36 |
 Kevin Martin |
SAC | 38.1% | 80 | 505 | 1,067 | 47.3% |
| 37 |
 Chucky Atkins |
MEM | 37.9% | 75 | 310 | 715 | 43.4% |
| 38 |
 James Jones |
PHX | 37.8% | 76 | 162 | 440 | 36.8% |
| 39 |
 Quentin Richardson |
NYK | 37.6% | 49 | 228 | 545 | 41.8% |
| 40 |
 Linas Kleiza |
DEN | 37.6% | 79 | 200 | 474 | 42.2% |
| 41 |
 James Posey |
MIA | 37.5% | 71 | 186 | 432 | 43.1% |
| 42 |
 Andrea Bargnani |
TOR | 37.3% | 65 | 267 | 625 | 42.7% |
| 43 |
 Ray Allen |
SEA | 37.2% | 55 | 505 | 1,153 | 43.8% |
| 44 |
 Rasual Butler |
NOK | 36.9% | 81 | 314 | 788 | 39.8% |
| 45 |
 Gerald Green |
BOS | 36.8% | 81 | 310 | 739 | 41.9% |
| 46 |
 Matt Barnes |
GSW | 36.6% | 76 | 275 | 628 | 43.8% |
| 47 |
 Smush Parker |
LAL | 36.5% | 82 | 342 | 785 | 43.6% |
| 48 |
 Jason Richardson |
GSW | 36.5% | 51 | 306 | 734 | 41.7% |
| 49 |
 Antawn Jamison |
WAS | 36.4% | 70 | 512 | 1,139 | 45.0% |
| 50 |
 Martell Webster |
POR | 36.4% | 82 | 195 | 492 | 39.6% |
1–50 of 76Next →