

2009-2010 NBA Three-Point Percentage Leaders
Share of three-pointers made
Mike Miller led the NBA in three-point percentage in 2009-2010 with 48.0%, 2.2 percentage points ahead of Jared Dudley (45.8%). It stands 10th among all single seasons in NBA history.
Showing players who met the games-played minimum for the season. Show all players
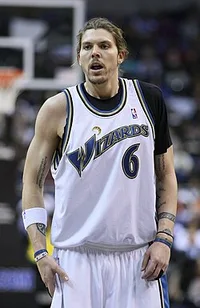 Led the NBA in 2009-2010
Mike Miller
WAS
48.0%
Three-Point Percentage
2.2% clear of Jared Dudley
Showing Three-Point Percentage and the stats that give it context
Full stat line
| # | Player | Team | 3P% | GP | FGM | FGA | FG% |
|---|---|---|---|---|---|---|---|
| 1 |
 Mike Miller |
WAS | 48.0% | 54 | 217 | 433 | 50.1% |
| 2 |
 Jared Dudley |
PHX | 45.8% | 82 | 225 | 490 | 45.9% |
| 3 |
 Anthony Morrow |
GSW | 45.6% | 69 | 329 | 703 | 46.8% |
| 4 |
 Channing Frye |
PHX | 43.9% | 81 | 317 | 703 | 45.1% |
| 5 |
 Stephen Curry |
GSW | 43.7% | 80 | 528 | 1,143 | 46.2% |
| 6 |
 Arron Afflalo |
DEN | 43.4% | 82 | 272 | 585 | 46.5% |
| 7 |
 Mo Williams |
CLE | 42.9% | 69 | 378 | 855 | 44.2% |
| 8 |
 Steve Nash |
PHX | 42.6% | 81 | 499 | 985 | 50.7% |
| 9 |
 Jason Kidd |
DAL | 42.5% | 80 | 284 | 671 | 42.3% |
| 10 |
 Paul Pierce |
BOS | 41.4% | 71 | 409 | 867 | 47.2% |
| 11 |
 Anthony Parker |
CLE | 41.4% | 81 | 206 | 475 | 43.4% |
| 12 |
 Jarrett Jack |
TOR | 41.2% | 82 | 323 | 671 | 48.1% |
| 13 |
 Brandon Rush |
IND | 41.1% | 82 | 297 | 702 | 42.3% |
| 14 |
 JJ Redick |
ORL | 40.5% | 82 | 243 | 553 | 43.9% |
| 15 |
 Aaron Brooks |
HOU | 39.8% | 82 | 575 | 1,331 | 43.2% |
| 16 |
 Rashard Lewis |
ORL | 39.7% | 72 | 350 | 805 | 43.5% |
| 17 |
 Quentin Richardson |
MIA | 39.7% | 76 | 242 | 561 | 43.1% |
| 18 |
 Steve Blake |
LAC | 39.5% | 80 | 217 | 522 | 41.6% |
| 19 |
 Jason Richardson |
PHX | 39.3% | 79 | 473 | 998 | 47.4% |
| 20 |
 Nate Robinson |
BOS | 39.0% | 56 | 215 | 493 | 43.6% |
| 21 |
 Matt Bonner |
SAS | 39.0% | 65 | 166 | 372 | 44.6% |
| 22 |
 Mike Bibby |
ATL | 38.9% | 80 | 268 | 644 | 41.6% |
| 23 |
 Mike Conley |
MEM | 38.7% | 80 | 369 | 830 | 44.5% |
| 24 |
 Chauncey Billups |
DEN | 38.6% | 73 | 402 | 962 | 41.8% |
| 25 |
 Andres Nocioni |
SAC | 38.6% | 75 | 234 | 587 | 39.9% |
| 26 |
 Mehmet Okur |
UTA | 38.5% | 73 | 355 | 775 | 45.8% |
| 27 |
 Troy Murphy |
IND | 38.4% | 72 | 384 | 813 | 47.2% |
| 28 |
 O.J. Mayo |
MEM | 38.3% | 82 | 542 | 1,183 | 45.8% |
| 29 |
 John Salmons |
MIL | 38.2% | 81 | 437 | 991 | 44.1% |
| 30 |
 Jamal Crawford |
ATL | 38.2% | 79 | 496 | 1,105 | 44.9% |
| 31 |
 Danilo Gallinari |
NYK | 38.1% | 81 | 392 | 927 | 42.3% |
| 32 |
 Jameer Nelson |
ORL | 38.1% | 65 | 317 | 706 | 44.9% |
| 33 |
 Jason Williams |
ORL | 38.0% | 82 | 189 | 426 | 44.4% |
| 34 |
 Mickael Pietrus |
ORL | 37.9% | 75 | 233 | 539 | 43.2% |
| 35 |
 Manu Ginobili |
SAS | 37.7% | 75 | 398 | 903 | 44.1% |
| 36 |
 Jordan Farmar |
LAL | 37.6% | 82 | 224 | 515 | 43.5% |
| 37 |
 James Harden |
OKC | 37.5% | 76 | 233 | 578 | 40.3% |
| 38 |
 Peja Stojakovic |
NOH | 37.5% | 62 | 278 | 688 | 40.4% |
| 39 |
 Marcus Thornton |
NOH | 37.4% | 73 | 398 | 883 | 45.1% |
| 40 |
 Brandon Jennings |
MIL | 37.4% | 82 | 451 | 1,216 | 37.1% |
| 41 |
 Hedo Turkoglu |
TOR | 37.4% | 74 | 276 | 674 | 40.9% |
| 42 |
 Martell Webster |
POR | 37.3% | 82 | 259 | 639 | 40.5% |
| 43 |
 Andrea Bargnani |
TOR | 37.2% | 80 | 537 | 1,143 | 47.0% |
| 44 |
 Kirk Hinrich |
CHI | 37.1% | 74 | 308 | 753 | 40.9% |
| 45 |
 Eric Gordon |
LAC | 37.1% | 62 | 352 | 784 | 44.9% |
| 46 |
 Deron Williams |
UTA | 37.1% | 76 | 494 | 1,053 | 46.9% |
| 47 |
 Chase Budinger |
HOU | 36.9% | 74 | 249 | 565 | 44.1% |
| 48 |
 Joe Johnson |
ATL | 36.9% | 76 | 635 | 1,386 | 45.8% |
| 49 |
 Rudy Fernandez |
POR | 36.8% | 62 | 160 | 423 | 37.8% |
| 50 |
 Vince Carter |
ORL | 36.7% | 75 | 434 | 1,015 | 42.8% |
1–50 of 73Next →