

1973-1974 NBA Free Throw Percentage Leaders
Share of free throws made
Ernie DiGregorio led the NBA in free throw percentage in 1973-1974 with 90.2%, 0.3 percentage points ahead of Rick Barry (89.9%). It was one of 2 times Ernie DiGregorio led in free throw percentage.
Showing players who met the games-played minimum for the season. Show all players
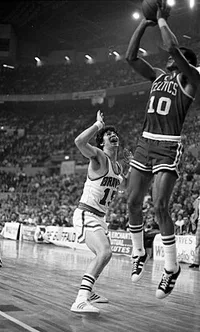 Led the NBA in 1973-1974
Ernie DiGregorio
BUF
90.2%
Free Throw Percentage
0.3% clear of Rick Barry
Showing Free Throw Percentage and the stats that give it context
Full stat line
| # | Player | Team | FT% | GP | FGM | FGA | FG% |
|---|---|---|---|---|---|---|---|
| 1 |
 Ernie DiGregorio |
BUF | 90.2% | 81 | 530 | 1,260 | 42.1% |
| 2 |
 Rick Barry |
GOS | 89.9% | 80 | 796 | 1,746 | 45.6% |
| 3 |
 Jeff Mullins |
GOS | 87.5% | 77 | 541 | 1,144 | 47.3% |
| 4 |
 Chet Walker |
CHI | 87.5% | 82 | 572 | 1,178 | 48.6% |
| 5 |
 Bill Bradley |
NYK | 87.4% | 82 | 502 | 1,112 | 45.1% |
| 6 |
 Calvin Murphy |
HOU | 86.8% | 81 | 671 | 1,285 | 52.2% |
| 7 |
 Dick Snyder |
SEA | 86.6% | 74 | 572 | 1,189 | 48.1% |
| 8 |
 Gail Goodrich |
LAL | 86.4% | 82 | 784 | 1,773 | 44.2% |
| 9 |
 Fred Brown |
SEA | 86.3% | 82 | 578 | 1,226 | 47.1% |
| 10 |
 Jim McMillian |
BUF | 85.8% | 82 | 600 | 1,214 | 49.4% |
| 11 |
 Mike Newlin |
HOU | 85.6% | 76 | 510 | 1,139 | 44.8% |
| 12 |
 Austin Carr |
CLE | 85.6% | 81 | 748 | 1,682 | 44.5% |
| 13 |
 Dick Van Arsdale |
PHX | 85.3% | 78 | 514 | 1,028 | 50.0% |
| 14 |
 Geoff Petrie |
POR | 85.3% | 73 | 740 | 1,537 | 48.1% |
| 15 |
 Tom Van Arsdale |
PHL | 85.1% | 78 | 614 | 1,433 | 42.8% |
| 16 |
 Rudy Tomjanovich |
HOU | 84.8% | 80 | 788 | 1,470 | 53.6% |
| 17 |
 Stu Lantz |
DET | 84.8% | 50 | 154 | 361 | 42.7% |
| 18 | Clem Haskins | PHX | 84.2% | 81 | 364 | 792 | 46.0% |
| 19 |
 Larry Jones |
PHL | 83.8% | 72 | 263 | 622 | 42.3% |
| 20 |
 Walt Frazier |
NYK | 83.8% | 80 | 674 | 1,429 | 47.2% |
| 21 |
 Jojo White |
BOS | 83.7% | 82 | 649 | 1,445 | 44.9% |
| 22 |
 Lou Hudson |
ATL | 83.6% | 65 | 678 | 1,356 | 50.0% |
| 23 |
 Cazzie Russell |
GOS | 83.5% | 82 | 738 | 1,531 | 48.2% |
| 24 |
 Bob Weiss |
CHI | 83.5% | 79 | 263 | 564 | 46.6% |
| 25 |
 Oscar Robertson |
MIL | 83.5% | 70 | 338 | 772 | 43.8% |
| 26 |
 Jerry West |
LAL | 83.3% | 31 | 232 | 519 | 44.7% |
| 27 |
 Dave Cowens |
BOS | 83.2% | 80 | 645 | 1,475 | 43.7% |
| 28 |
 John Havlicek |
BOS | 83.2% | 76 | 685 | 1,502 | 45.6% |
| 29 |
 Don Chaney |
BOS | 82.8% | 81 | 348 | 750 | 46.4% |
| 30 |
 Pete Maravich |
ATL | 82.6% | 76 | 819 | 1,791 | 45.7% |
| 31 | Jim Fox | SEA | 82.3% | 78 | 322 | 673 | 47.8% |
| 32 |
 Bingo Smith |
CLE | 82.2% | 82 | 536 | 1,179 | 45.5% |
| 33 |
 Phil Chenier |
CAP | 82.0% | 76 | 697 | 1,607 | 43.4% |
| 34 |
 Nate Archibald |
KCK | 82.0% | 35 | 222 | 492 | 45.1% |
| 35 |
 Nate Williams |
KCK | 81.8% | 82 | 538 | 1,165 | 46.2% |
| 36 | Bob Dandridge | MIL | 81.8% | 71 | 583 | 1,158 | 50.3% |
| 37 |
 Bob Love |
CHI | 81.8% | 82 | 731 | 1,752 | 41.7% |
| 38 | Spencer Haywood | SEA | 81.4% | 75 | 694 | 1,520 | 45.7% |
| 39 |
 Jim Barnett |
GOS | 81.4% | 77 | 350 | 755 | 46.4% |
| 40 |
 Dave Bing |
DET | 81.3% | 81 | 582 | 1,336 | 43.6% |
| 41 |
 John Johnson |
POR | 81.2% | 69 | 459 | 990 | 46.4% |
| 42 | Dick Gibbs | SEA | 80.6% | 71 | 302 | 700 | 43.1% |
| 43 |
 Zaid Abdul-Aziz |
HOU | 80.4% | 79 | 336 | 732 | 45.9% |
| 44 |
 Keith Erickson |
PHX | 80.1% | 66 | 393 | 824 | 47.7% |
| 45 |
 Lenny Wilkens |
CLE | 80.1% | 74 | 462 | 994 | 46.5% |
| 46 |
 Jim Price |
LAL | 79.9% | 82 | 538 | 1,197 | 44.9% |
| 47 |
 Bob Lanier |
DET | 79.7% | 81 | 748 | 1,483 | 50.4% |
| 48 |
 John Block |
KCK | 79.6% | 82 | 275 | 634 | 43.4% |
| 49 | John Mengelt | DET | 79.5% | 77 | 249 | 558 | 44.6% |
| 50 |
 Bob McAdoo |
BUF | 79.3% | 74 | 901 | 1,647 | 54.7% |
1–50 of 86Next →