

2004-2005 NBA True Shooting Percentage Leaders
Shooting efficiency including free throws
Danny Fortson led the NBA in true shooting percentage in 2004-2005 with 68.2%, 1.8 percentage points ahead of Fred Hoiberg (66.4%). It stands 64th among all single seasons in NBA history.
Showing players who met the games-played minimum for the season. Show all players
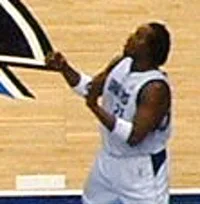 Led the NBA in 2004-2005
Danny Fortson
SEA
68.2%
True Shooting Percentage
1.8% clear of Fred Hoiberg
Showing True Shooting Percentage and the stats that give it context
Full stat line
| # | Player | Team | TS% | GP | FGM | FGA | FG% |
|---|---|---|---|---|---|---|---|
| 1 |
 Danny Fortson |
SEA | 68.2% | 62 | 118 | 226 | 52.2% |
| 2 |
 Fred Hoiberg |
MIN | 66.4% | 76 | 139 | 284 | 48.9% |
| 3 | Greg Buckner | DEN | 63.8% | 70 | 160 | 303 | 52.8% |
| 4 |
 Damon Jones |
MIA | 62.5% | 82 | 331 | 726 | 45.6% |
| 5 |
 Amar'e Stoudemire |
PHX | 61.7% | 80 | 747 | 1,336 | 55.9% |
| 6 |
 Mike Miller |
MEM | 61.4% | 76 | 387 | 766 | 50.5% |
| 7 |
 Yao Ming |
HOU | 61.4% | 80 | 538 | 975 | 55.2% |
| 8 |
 Chauncey Billups |
DET | 60.9% | 80 | 404 | 913 | 44.2% |
| 9 |
 Manu Ginobili |
SAS | 60.9% | 74 | 367 | 780 | 47.1% |
| 10 |
 Jason Terry |
DAL | 60.6% | 80 | 372 | 743 | 50.1% |
| 11 |
 Steve Nash |
PHX | 60.6% | 75 | 430 | 857 | 50.2% |
| 12 | DerMarr Johnson | DEN | 60.5% | 71 | 185 | 371 | 49.9% |
| 13 |
 Kelvin Cato |
ORL | 60.0% | 62 | 160 | 297 | 53.9% |
| 14 |
 Andrei Kirilenko |
UTA | 59.9% | 41 | 207 | 420 | 49.3% |
| 15 |
 Matt Bonner |
TOR | 59.6% | 82 | 247 | 463 | 53.3% |
| 16 |
 Joel Przybilla |
POR | 59.6% | 76 | 199 | 333 | 59.8% |
| 17 |
 Brad Miller |
SAC | 59.6% | 56 | 319 | 609 | 52.4% |
| 18 |
 Wally Szczerbiak |
MIN | 59.5% | 81 | 465 | 919 | 50.6% |
| 19 | Michael Sweetney | NYK | 59.2% | 77 | 237 | 446 | 53.1% |
| 20 |
 Donyell Marshall |
TOR | 59.1% | 65 | 262 | 592 | 44.3% |
| 21 |
 Kyle Korver |
PHI | 58.8% | 82 | 317 | 759 | 41.8% |
| 22 |
 Udonis Haslem |
MIA | 58.8% | 80 | 346 | 641 | 54.0% |
| 23 |
 Brendan Haywood |
WAS | 58.8% | 68 | 239 | 427 | 56.0% |
| 24 |
 Raef LaFrentz |
BOS | 58.7% | 80 | 341 | 688 | 49.6% |
| 25 |
 Peja Stojakovic |
SAC | 58.4% | 66 | 451 | 1,016 | 44.4% |
| 26 |
 Paul Pierce |
BOS | 58.3% | 82 | 556 | 1,223 | 45.5% |
| 27 |
 Shaquille O'Neal |
MIA | 58.3% | 73 | 658 | 1,095 | 60.1% |
| 28 |
 Eddy Curry |
CHI | 58.3% | 63 | 393 | 730 | 53.8% |
| 29 |
 Pau Gasol |
MEM | 58.2% | 56 | 357 | 695 | 51.4% |
| 30 |
 Reggie Miller |
IND | 58.2% | 66 | 314 | 719 | 43.7% |
| 31 |
 Shareef Abdur-Rahim |
POR | 58.1% | 54 | 337 | 670 | 50.3% |
| 32 |
 Chris Andersen |
NOH | 58.1% | 67 | 191 | 358 | 53.4% |
| 33 |
 Andre Iguodala |
PHI | 58.0% | 82 | 269 | 546 | 49.3% |
| 34 |
 Erick Dampier |
DAL | 58.0% | 59 | 202 | 367 | 55.0% |
| 35 |
 Brent Barry |
SAS | 58.0% | 81 | 194 | 459 | 42.3% |
| 36 |
 Dirk Nowitzki |
DAL | 57.8% | 78 | 663 | 1,445 | 45.9% |
| 37 |
 Leandro Barbosa |
PHX | 57.5% | 63 | 168 | 354 | 47.5% |
| 38 |
 Stephon Marbury |
NYK | 57.5% | 82 | 604 | 1,308 | 46.2% |
| 39 |
 Corey Maggette |
LAC | 57.4% | 66 | 425 | 986 | 43.1% |
| 40 |
 Dwight Howard |
ORL | 57.1% | 82 | 352 | 677 | 52.0% |
| 41 |
 Rashard Lewis |
SEA | 57.1% | 71 | 532 | 1,151 | 46.2% |
| 42 |
 Mikki Moore |
LAC | 57.1% | 74 | 144 | 287 | 50.2% |
| 43 |
 Nick Collison |
SEA | 57.0% | 82 | 190 | 354 | 53.7% |
| 44 |
 Jon Barry |
HOU | 57.0% | 69 | 161 | 368 | 43.8% |
| 45 |
 Mehmet Okur |
UTA | 56.9% | 82 | 354 | 756 | 46.8% |
| 46 |
 Kevin Garnett |
MIN | 56.7% | 82 | 683 | 1,360 | 50.2% |
| 47 |
 Darius Songaila |
SAC | 56.6% | 81 | 257 | 488 | 52.7% |
| 48 |
 Grant Hill |
ORL | 56.5% | 67 | 517 | 1,015 | 50.9% |
| 49 |
 Gilbert Arenas |
WAS | 56.5% | 80 | 656 | 1,523 | 43.1% |
| 50 |
 Tyson Chandler |
CHI | 56.5% | 80 | 207 | 419 | 49.4% |
1–50 of 263Next →