

2018-2019 NBA Effective FG Percentage Leaders
Field goal percentage weighting threes
Rudy Gobert led the NBA in effective fg percentage in 2018-2019 with 66.9%, 2.1 percentage points ahead of Thomas Bryant (64.8%). It stands 22nd among all single seasons in NBA history. It was one of 5 times Rudy Gobert led in effective fg percentage.
Showing players who met the games-played minimum for the season. Show all players
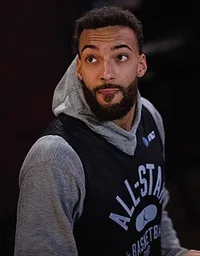 Led the NBA in 2018-2019
Rudy Gobert
UTA
66.9%
Effective FG Percentage
2.1% clear of Thomas Bryant
Showing Effective FG Percentage and the stats that give it context
Full stat line
| # | Player | Team | eFG% | GP | FGM | FGA | FG% |
|---|---|---|---|---|---|---|---|
| 1 |
 Rudy Gobert |
UTA | 66.9% | 81 | 476 | 712 | 66.9% |
| 2 |
 Thomas Bryant |
WAS | 64.8% | 72 | 309 | 502 | 61.6% |
| 3 |
 Clint Capela |
HOU | 64.8% | 67 | 474 | 732 | 64.8% |
| 4 |
 JaVale McGee |
LAL | 62.5% | 75 | 400 | 641 | 62.4% |
| 5 |
 Joe Harris |
BKN | 62.2% | 76 | 374 | 748 | 50.0% |
| 6 |
 Montrezl Harrell |
LAC | 61.7% | 82 | 546 | 888 | 61.5% |
| 7 |
 Stephen Curry |
GSW | 60.4% | 69 | 632 | 1,340 | 47.2% |
| 8 |
 Derrick Favors |
UTA | 60.0% | 76 | 363 | 619 | 58.6% |
| 9 |
 Giannis Antetokounmpo |
MIL | 59.9% | 72 | 721 | 1,247 | 57.8% |
| 10 |
 Domantas Sabonis |
IND | 59.6% | 74 | 413 | 700 | 59.0% |
| 11 |
 Jarrett Allen |
BKN | 59.5% | 80 | 335 | 568 | 59.0% |
| 12 |
 Steven Adams |
OKC | 59.5% | 80 | 481 | 809 | 59.5% |
| 13 |
 John Collins |
ATL | 59.3% | 61 | 465 | 831 | 56.0% |
| 14 |
 Pascal Siakam |
TOR | 59.1% | 80 | 519 | 945 | 54.9% |
| 15 |
 Al Horford |
BOS | 58.6% | 68 | 387 | 723 | 53.5% |
| 16 |
 Deandre Ayton |
PHX | 58.5% | 71 | 509 | 870 | 58.5% |
| 17 |
 Malik Beasley |
DEN | 58.4% | 81 | 349 | 737 | 47.4% |
| 18 |
 Taj Gibson |
MIN | 57.6% | 70 | 304 | 537 | 56.6% |
| 19 |
 Malcolm Brogdon |
MIL | 57.5% | 64 | 378 | 748 | 50.5% |
| 20 |
 Robin Lopez |
CHI | 57.5% | 74 | 304 | 535 | 56.8% |
| 21 |
 Bojan Bogdanovic |
IND | 57.5% | 81 | 522 | 1,051 | 49.7% |
| 22 |
 Jonas Valanciunas |
MEM | 57.2% | 49 | 301 | 538 | 55.9% |
| 23 |
 Karl-Anthony Towns |
MIN | 57.2% | 77 | 681 | 1,314 | 51.8% |
| 24 |
 Hassan Whiteside |
MIA | 57.2% | 72 | 388 | 680 | 57.1% |
| 25 |
 Kevin Durant |
GSW | 57.1% | 78 | 721 | 1,383 | 52.1% |
| 26 |
 Brook Lopez |
MIL | 57.1% | 81 | 355 | 786 | 45.2% |
| 27 |
 Bryn Forbes |
SAS | 56.8% | 82 | 361 | 791 | 45.6% |
| 28 |
 Jerami Grant |
OKC | 56.7% | 80 | 409 | 823 | 49.7% |
| 29 |
 D.J. Augustin |
ORL | 56.6% | 81 | 318 | 677 | 47.0% |
| 30 |
 Joe Ingles |
UTA | 56.5% | 82 | 359 | 802 | 44.8% |
| 31 |
 Ben Simmons |
PHI | 56.3% | 79 | 540 | 960 | 56.3% |
| 32 |
 Buddy Hield |
SAC | 56.0% | 82 | 623 | 1,360 | 45.8% |
| 33 |
 LeBron James |
LAL | 56.0% | 55 | 558 | 1,095 | 51.0% |
| 34 |
 Monte Morris |
DEN | 56.0% | 82 | 346 | 702 | 49.3% |
| 35 |
 Thaddeus Young |
IND | 55.7% | 81 | 443 | 841 | 52.7% |
| 36 |
 Serge Ibaka |
TOR | 55.7% | 74 | 464 | 877 | 52.9% |
| 37 |
 JJ Redick |
PHI | 55.7% | 76 | 452 | 1,027 | 44.0% |
| 38 |
 Kyrie Irving |
BOS | 55.7% | 67 | 604 | 1,241 | 48.7% |
| 39 |
 Willie Cauley-Stein |
SAC | 55.7% | 81 | 412 | 741 | 55.6% |
| 40 |
 Enes Freedom |
POR | 55.6% | 67 | 375 | 683 | 54.9% |
| 41 |
 Jeff Green |
WAS | 55.5% | 77 | 326 | 687 | 47.5% |
| 42 |
 Julius Randle |
NOP | 55.5% | 73 | 571 | 1,089 | 52.4% |
| 43 |
 Danilo Gallinari |
LAC | 55.4% | 68 | 409 | 884 | 46.3% |
| 44 |
 Rudy Gay |
SAS | 55.4% | 69 | 376 | 746 | 50.4% |
| 45 |
 Klay Thompson |
GSW | 55.3% | 78 | 655 | 1,402 | 46.7% |
| 46 |
 Alex Len |
ATL | 55.1% | 77 | 320 | 648 | 49.4% |
| 47 |
 Tobias Harris |
PHI | 54.9% | 82 | 611 | 1,254 | 48.7% |
| 48 |
 Nikola Vucevic |
ORL | 54.9% | 80 | 701 | 1,354 | 51.8% |
| 49 |
 Eric Bledsoe |
MIL | 54.8% | 78 | 470 | 971 | 48.4% |
| 50 |
 Kawhi Leonard |
TOR | 54.6% | 60 | 560 | 1,129 | 49.6% |
1–50 of 120Next →