

2023-2024 NBA Three-Point Percentage Leaders
Share of three-pointers made
Grayson Allen led the NBA in three-point percentage in 2023-2024 with 46.1%, 1.1 percentage points ahead of Luke Kennard (45.0%). It stands 40th among all single seasons in NBA history.
Showing players who met the games-played minimum for the season. Show all players
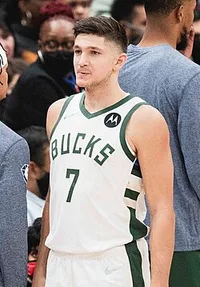 Led the NBA in 2023-2024
Grayson Allen
PHX
46.1%
Three-Point Percentage
1.1% clear of Luke Kennard
Showing Three-Point Percentage and the stats that give it context
Full stat line
| # | Player | Team | 3P% | GP | FGM | FGA | FG% |
|---|---|---|---|---|---|---|---|
| 1 |
 Grayson Allen |
PHX | 46.1% | 75 | 340 | 682 | 49.9% |
| 2 |
 Luke Kennard |
MEM | 45.0% | 39 | 141 | 315 | 44.8% |
| 3 |
 Mike Conley |
MIN | 44.2% | 76 | 294 | 644 | 45.7% |
| 4 |
 Garrison Mathews |
ATL | 44.0% | 66 | 103 | 226 | 45.6% |
| 5 |
 Norman Powell |
LAC | 43.5% | 76 | 373 | 768 | 48.6% |
| 6 |
 Bradley Beal |
PHX | 43.0% | 53 | 377 | 735 | 51.3% |
| 7 |
 CJ McCollum |
NOP | 42.9% | 66 | 484 | 1,055 | 45.9% |
| 8 |
 Jrue Holiday |
BOS | 42.9% | 69 | 331 | 689 | 48.0% |
| 9 |
 Jalen Williams |
OKC | 42.7% | 71 | 536 | 993 | 54.0% |
| 10 |
 Jamal Murray |
DEN | 42.5% | 59 | 474 | 986 | 48.1% |
| 11 |
 Sam Hauser |
BOS | 42.4% | 79 | 249 | 558 | 44.6% |
| 12 |
 Rui Hachimura |
LAL | 42.2% | 68 | 363 | 676 | 53.7% |
| 13 |
 Aaron Nesmith |
IND | 41.9% | 72 | 315 | 635 | 49.6% |
| 14 |
 Cason Wallace |
OKC | 41.9% | 82 | 217 | 442 | 49.1% |
| 15 |
 Al Horford |
BOS | 41.9% | 65 | 214 | 419 | 51.1% |
| 16 |
 Herbert Jones |
NOP | 41.8% | 76 | 293 | 588 | 49.8% |
| 17 |
 Kawhi Leonard |
LAC | 41.7% | 68 | 610 | 1,162 | 52.5% |
| 18 |
 Isaiah Joe |
OKC | 41.6% | 78 | 222 | 485 | 45.8% |
| 19 |
 Karl-Anthony Towns |
MIN | 41.6% | 62 | 479 | 951 | 50.4% |
| 20 |
 D'Angelo Russell |
LAL | 41.5% | 76 | 492 | 1,080 | 45.6% |
| 21 |
 Naz Reid |
MIN | 41.4% | 81 | 406 | 851 | 47.7% |
| 22 |
 Tyus Jones |
WAS | 41.4% | 66 | 326 | 666 | 48.9% |
| 23 |
 Malik Beasley |
MIL | 41.3% | 79 | 320 | 722 | 44.3% |
| 24 |
 Paul George |
LAC | 41.3% | 74 | 582 | 1,236 | 47.1% |
| 25 |
 Kevin Durant |
PHX | 41.3% | 75 | 751 | 1,436 | 52.3% |
| 26 |
 Kyrie Irving |
DAL | 41.1% | 58 | 562 | 1,131 | 49.7% |
| 27 |
 Doug McDermott |
IND | 41.0% | 64 | 123 | 284 | 43.3% |
| 28 |
 LeBron James |
LAL | 41.0% | 71 | 685 | 1,269 | 54.0% |
| 29 |
 Miles McBride |
NYK | 41.0% | 68 | 205 | 454 | 45.2% |
| 30 |
 Alex Caruso |
CHI | 40.8% | 71 | 253 | 541 | 46.8% |
| 31 |
 Stephen Curry |
GSW | 40.8% | 74 | 650 | 1,445 | 45.0% |
| 32 |
 Bobby Portis |
MIL | 40.7% | 82 | 466 | 918 | 50.8% |
| 33 |
 Kentavious Caldwell-Pope |
DEN | 40.6% | 76 | 270 | 587 | 46.0% |
| 34 |
 Sam Merrill |
CLE | 40.4% | 61 | 158 | 393 | 40.2% |
| 35 |
 Ayo Dosunmu |
CHI | 40.3% | 76 | 360 | 719 | 50.1% |
| 36 |
 Obi Toppin |
IND | 40.3% | 82 | 332 | 579 | 57.3% |
| 37 |
 Jerami Grant |
POR | 40.2% | 54 | 383 | 850 | 45.1% |
| 38 |
 Donte DiVincenzo |
NYK | 40.1% | 81 | 445 | 1,004 | 44.3% |
| 39 |
 Simone Fontecchio |
DET | 40.1% | 66 | 252 | 548 | 46.0% |
| 40 |
 Jalen Brunson |
NYK | 40.1% | 77 | 790 | 1,648 | 47.9% |
| 41 |
 Lauri Markkanen |
UTA | 39.9% | 55 | 427 | 890 | 48.0% |
| 42 |
 Bojan Bogdanovic |
NYK | 39.8% | 57 | 309 | 681 | 45.4% |
| 43 |
 Jalen Suggs |
ORL | 39.7% | 75 | 336 | 714 | 47.1% |
| 44 |
 Michael Porter Jr. |
DEN | 39.7% | 81 | 522 | 1,079 | 48.4% |
| 45 |
 Tyler Herro |
MIA | 39.6% | 42 | 324 | 735 | 44.1% |
| 46 |
 Taurean Prince |
LAL | 39.6% | 78 | 253 | 572 | 44.2% |
| 47 |
 Derrick White |
BOS | 39.6% | 73 | 387 | 839 | 46.1% |
| 48 |
 Duncan Robinson |
MIA | 39.5% | 68 | 304 | 675 | 45.0% |
| 49 |
 Immanuel Quickley |
TOR | 39.5% | 68 | 388 | 894 | 43.4% |
| 50 |
 Luguentz Dort |
OKC | 39.4% | 79 | 288 | 657 | 43.8% |
1–50 of 155Next →